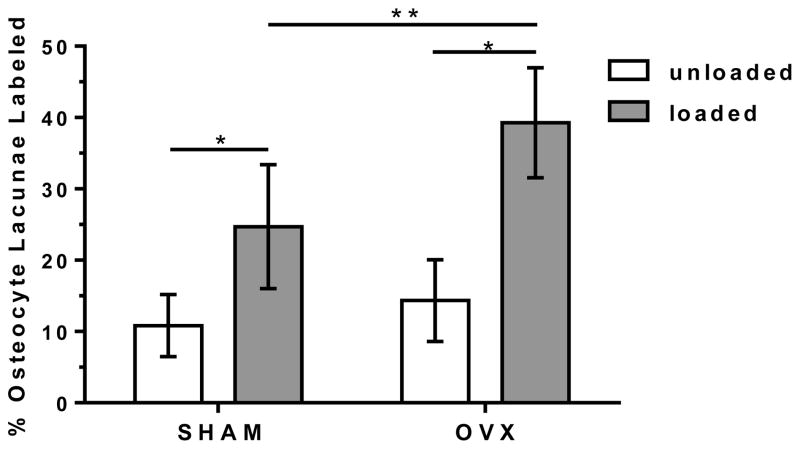
Figure 4.
The percentage of osteocyte lacunae labeled with injected tracer (mean ± SD) for the SHAM and OVX groups with the measurements at three anatomical locations (cortical metaphysis, cancellous metaphysis, and cancellous epiphysis) pooled for each animal for the loaded and contralateral, unloaded tibiae.
* significant difference compared to unloaded in same group (p < 0.05);
** significant difference compared to loaded SHAM (p < 0.05).

