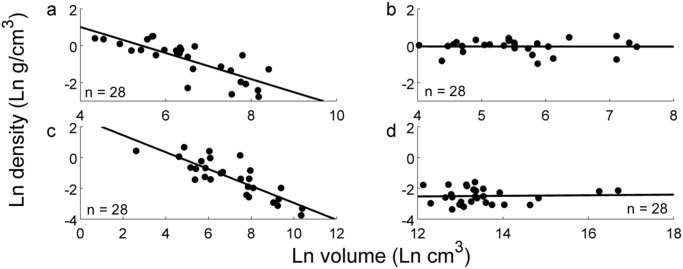
Fig 2. Comparison of density distribution for natural, artificial, liftable, and unliftable objects.
(a) 3-D scanned liftable artificial objects (Dataset 3 in S3 Dataset, n = 28) show a significant inverse correlation between log volume and density, while (b) 3-D scanned natural objects (Dataset 4 in S3 Dataset, n = 28) show no such relationship. Likewise, (c) a subset of randomly-selected objects from the liftable artificial objects collected via online survey (random subset of Dataset 2 in S2 Dataset, n = 28) also demonstrate this significant inverse correlation, but (d) artificial but unliftable objects collected via online survey (Dataset 5 in S2 Dataset, n = 28) show no correlation.

