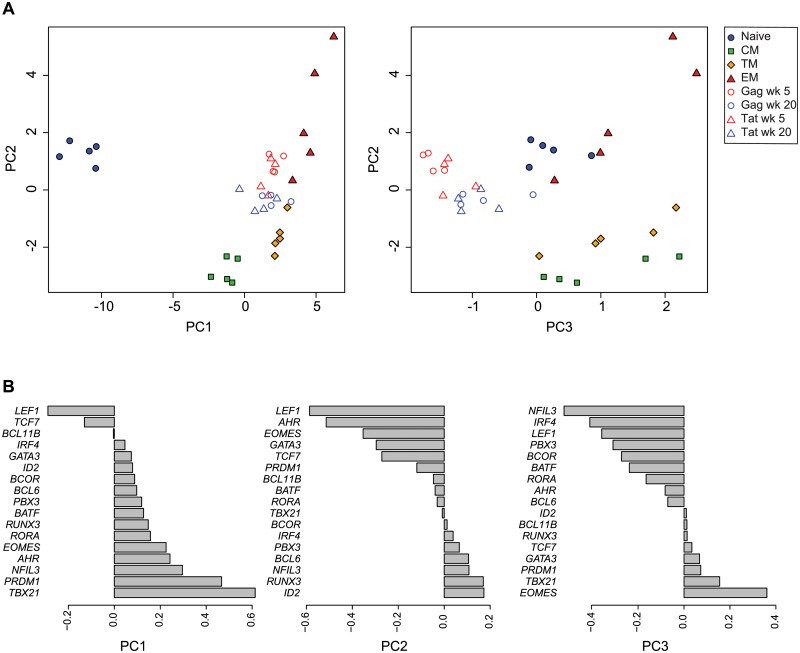
Fig 3. Principal component analysis of transcription factor expression profiles from SIV-specific MHC tetramer-sorted CD8+ T cells and sorted CD8+ T cell subsets.
(A) Plot of principal components 1 vs. 2, and 2 vs. 3 for each of the expression profiles assessed in sorted naïve and memory CD8+ T cell subsets isolated from healthy control animals (n = 5), and SIV-specific MHC tetramer-sorted CD8+ T cells isolated from animals (n = 4) at week 5 or week 20 following SIVΔnef vaccination. Principal components 1, 2 and 3 explain 92% of cumulative total variance. (B) PCA loading factors for each transcription factor.

