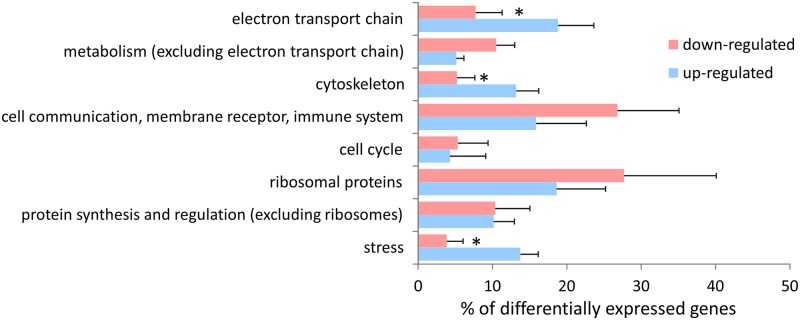
Fig 3. The percentage of genes within discrete intracellular process categories that were reported as either up- or down-regulated by the original authors [6, 13, 15, 18, 20, 21].

Bars = SEM (n = 6 different studies that verifiably reported direction of change), * denotes a significant difference between up- and down-regulation for that category (t-test, p < 0.05).
