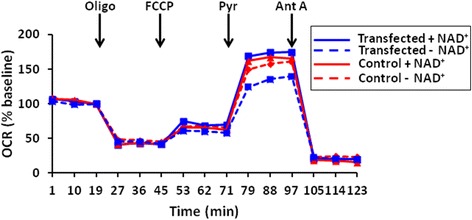
Figure 1.

OCR in APP (swe) -overexpressing N2A hippocampal neuroblastoma cells (blue lines) and control transfected cells (red lines). Baseline-normalized oxygen consumption rates (OCR) of N2A neuroblastoma cells exposed to successive additions of mitochondrial respiratory modulators (arrows) are shown. Cells received 1 μg/ml oligomycin (Oligo), 1 μM FCCP, 10 mM pyruvate (Pyr), and 1 μM antimycin A (Ant A). Subsets of the cells (solid lines) were pre-incubated with 10 mM nicotinamide adenine dinucleotide (NAD+) prior to measurements while control cells (dashed lines) had no exogenous NAD+. Rates are normalized to the third baseline measurement point for n = 3–5 replicates per group from 2 separate cultures.
