
Figure 3.
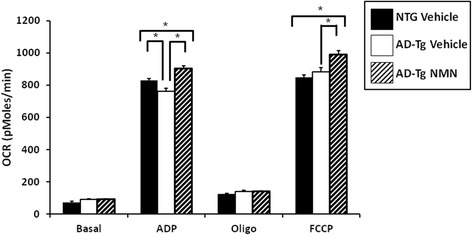
OCR deficits in non-synaptic brain mitochondria from mutant APP expressing mice following NMN treatment. Average OCR (pMoles/min) in non-synaptic mitochondria isolated from APP(swe)/PS1(ΔE9) (AD-Tg) and non-transgenic (NTG) mouse (3 months) brain. Solid black bar (NTG vehicle control), white bar (AD-Tg vehicle control) and striped bar (AD-Tg NMN). Data are presented as the average OCR ± SE. N = 3–5 separate animals per group. *p < 0.01.