
Figure 1.
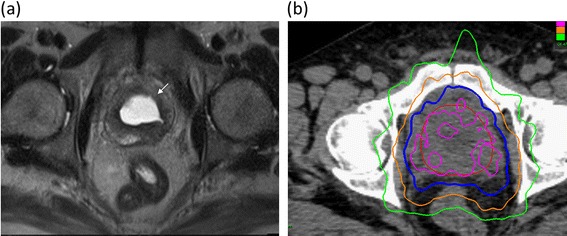
Treatment plan. (a) Axial T2-weighted MR image demonstrating central simple prostatectomy defect (arrow). (b) Treatment planning axial CT images demonstrating the prostate (red line). Isodose lines shown as follows: 115% of the prescription dose, pink line; 100% of the prescription dose, blue line: 75% of the prescription dose, orange line; and 50% of the prescription dose, green line.