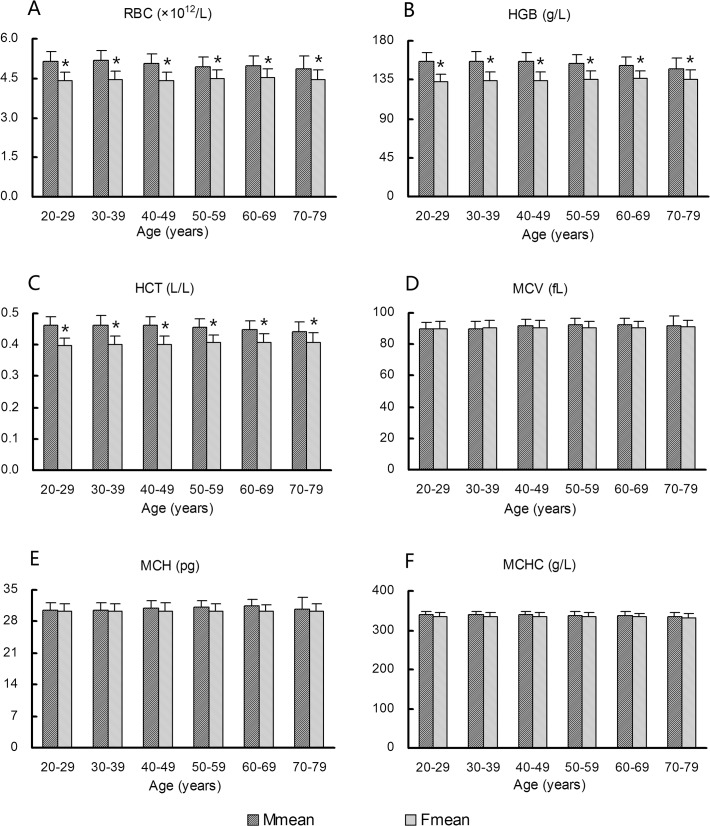
Fig 3. Variations in red blood cell (RBC) profile according to age and sex.
(A) RBC, (B) hemoglobin (HGB), (C) hematocrit (HCT), (D) mean corpuscular volume (MCV), (E) mean corpuscular hemoglobin (MCH), (F) MCH concentration (MCHC). *Females show significantly lower values (P < 0.05) than males in the same age group.

