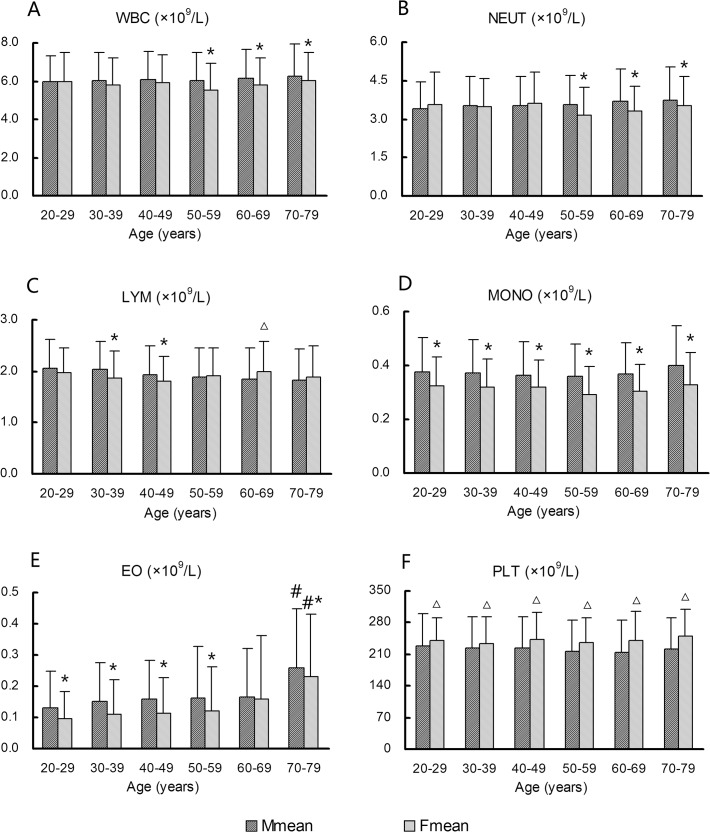
Fig 4. Variations in white blood cell (WBC) profile and platelet count (PLT) according to age and sex.
(A) WBC, (B) neutrophils (NEUT), (C) lymphocytes (LYM), (D) monocytes (MONO), (E) eosinophils (EO), (F) PLT. *Females show significantly lower values (P < 0.05) than males in the same age group. △Females show significantly higher values (P < 0.05) than males in the same age group. #EO values are significantly higher (P < 0.05) in the 70–79-year age group than in other age groups in males and females, respectively.

