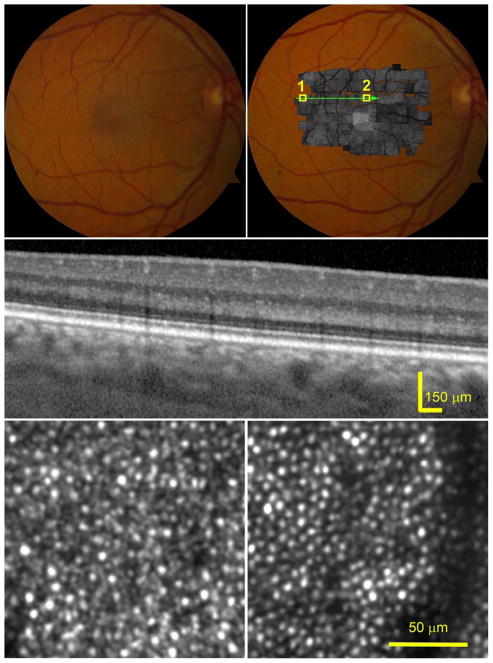
Figure 1.
Photoreceptors in a healthy retina imaged by adaptive optics scanning laser ophthalmoscopy (AOSLO) and spectral domain optical coherence tomography (SD-OCT) with enhanced depth imaging. The subject (AMD-051) is a 54-year-old man (Age-Related Eye Disease Study grade 1, best-corrected visual acuity 20/20). (Top row, left) Digital color fundus photograph of 30° field of vie w. (Top row, right) AOSLO montage in grayscale is overlaid on the fundus photograph. (Middle) SD-OCT B-Scans taken through the green arrow-line in the top-right panel show parallel and evenly reflective bands of the external limiting membrane (ELM), ellipsoidal zone (EZ), and the retinal pigment epithelium (RPE)-Bruch complex, with negligible diffuse accumulations between the EZ and RPE-Bruch complex. (Bottom row) AOSLO images contained in the boxes of the top-right panel, revealing clear photoreceptor mosaic. (Bottom row, left) Photoreceptors in the peripheral retina, box 1 in the top-right panel. Large, bright dots are cones, surrounded by smaller, dimmer dots representing rods. (Bottom row, right) Image was taken in the parafovea, box 2 in the top-right panel, most cells are cones. The dark band is the shadow of a retinal capillary. The reflectivity of individual photoreceptor varies,46 but there is no significant change of areal reflectivity on the retina.

