Figure 3.

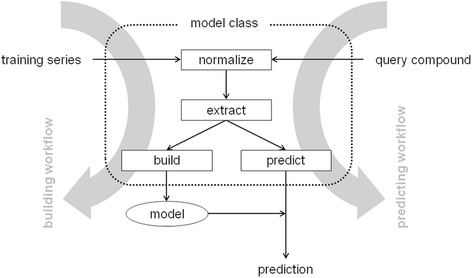
Schema of the main eTOXlab workflows: prediction (right hand side) and building (left hand side), indicating the input and output, and the model methods called. Notice that both workflows use the same normalize and extract methods.

Schema of the main eTOXlab workflows: prediction (right hand side) and building (left hand side), indicating the input and output, and the model methods called. Notice that both workflows use the same normalize and extract methods.