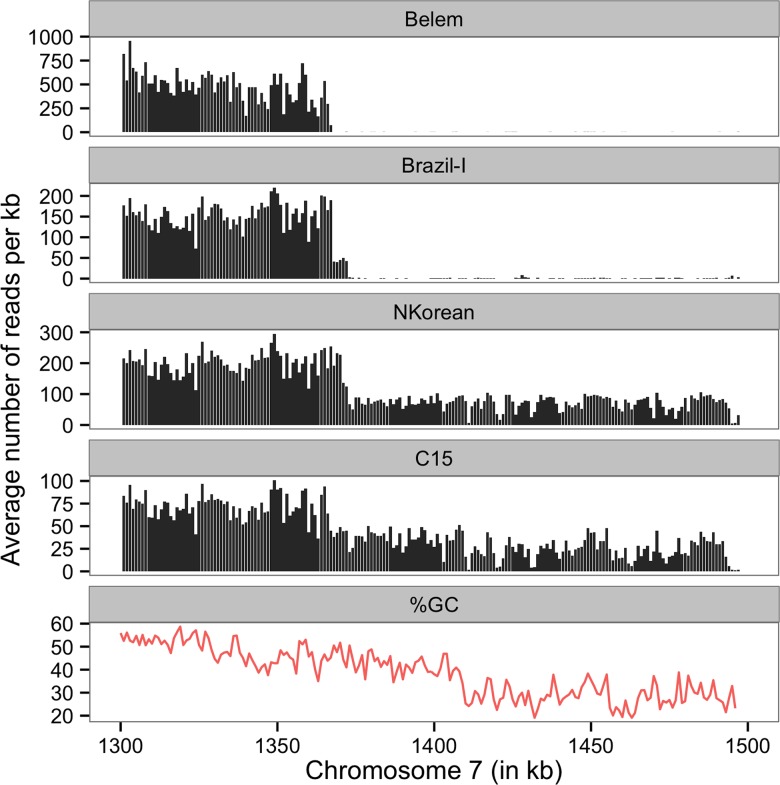
Fig 2. Shared telomeric deletion.
The figure shows a ~120 kb deletion indicated by the decrease in sequence coverage (y-axis, in reads per bp) at the telomeric end of chromosome 7 (x-axis in 1,000 bp). The sequence coverage is displayed, from top to bottom, for three monkey-adapted strains (Belem, Brazil-I and North Korea) and one Cambodian field isolate (C15). The bottom track shows the variation in GC content along this region. The lower coverage in North Korea and C15 indicates that only some of the parasites carry the deletion. Note also that the deletion boundary is different in different samples.

