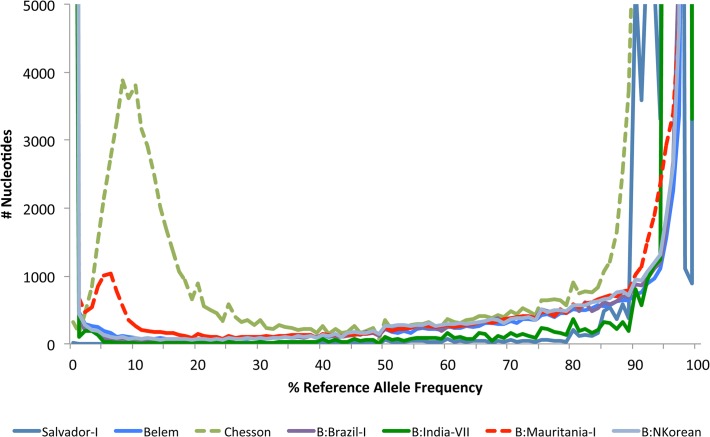
Fig 3. Distribution of the Reference Allele Frequency (RAF) in monkey-adapted strains sequenced to date.
The graph shows the number of variable positions (y-axis) in a given sample according to the proportion of reads carrying the reference (i.e., Salvador I) allele (x-axis, in %). For most monkey-adapted strains the distribution is U shaped consistent with the present of a single haploid clone. However, the RAF distributions for Mauritania-I (in dotted red) and Chesson (in dotted green) indicate the presence of a second clone. The RAF for the human isolates mentioned in the manuscript is presented in S1 Fig.

