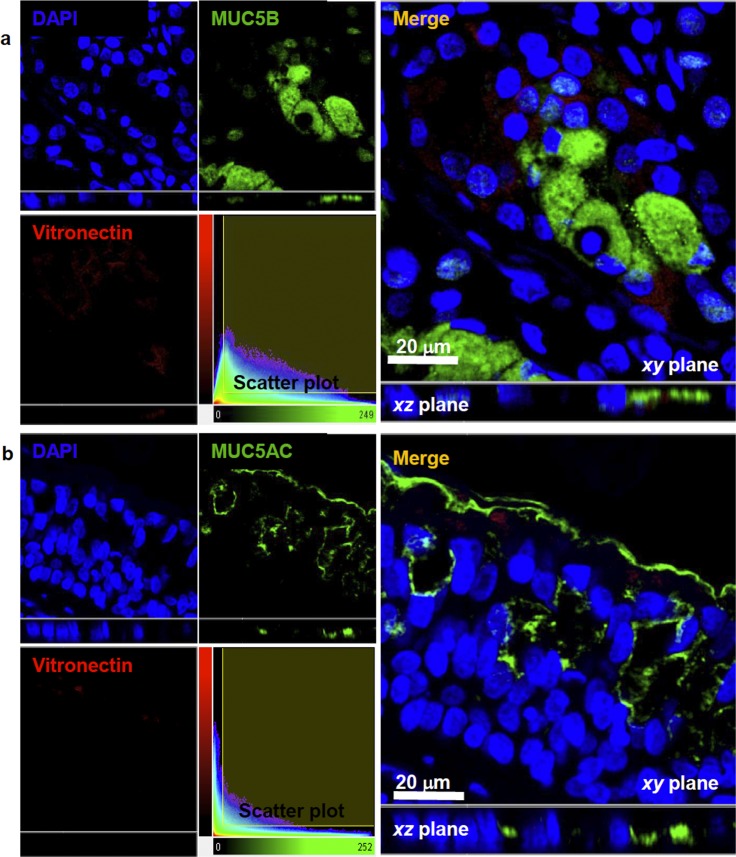
Fig 5. Colocalization of MUC5B or MUC5AC and vitronectin.
Confocal images showing localization of MUC5B (a) and MUC5AC (b) (green fluorescence), as markers of mucous cells in submucosal glands and epithelial goblet cells, respectively and vitronectin (red fluorescence). Overlay of green and red channels showed that vitronectin is not present in cells producing MUC5B (Rp 0.16, IQR 0.057–0.42) or MUC5AC (Rp 0.04; IQR 0.02–0.13). Nuclei were counterstained with DAPI (blue fluorescence). xy and xz views are shown to provide sufficient details of spatial distribution in the 3D subcellular space. The colocalization maps (scatter plots) of voxels are shown. MUC5B and MUC5AC emission intensities are plotted on the x-axis, while vitronectin is plotted on the y-axis. Rp, Pearson´s colocalization coefficient; IQR, interquartile range.

