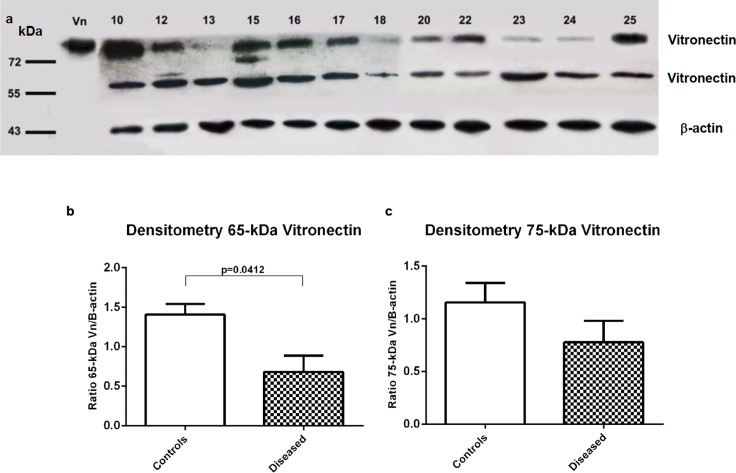
Fig 9. Western analysis of vitronectin isoforms expression in bronchial surface epithelium from bronchial brushings.
(a) Immunoblots of vitronectin expression in control individuals (number 10, 15 and 17) and diseased subjects (numbers 12, 13, 16, 18, 20, 22, 23, 24 and 25). 65- and 75-kDa vitronectin isoforms are presents in all subjects. β-actin was used as a control for protein loading. (b-c) Quantification by densitometry of 65- and 75-kDa vitronectin isoforms. 65-kDa vitronectin expression was lower in diseased subjects when compared with control individuals (p = 0.0412). The vitronectin/β-actin ratio is represented on the y axes for controls and diseased subjects. Error bars represent the standard error of means.

