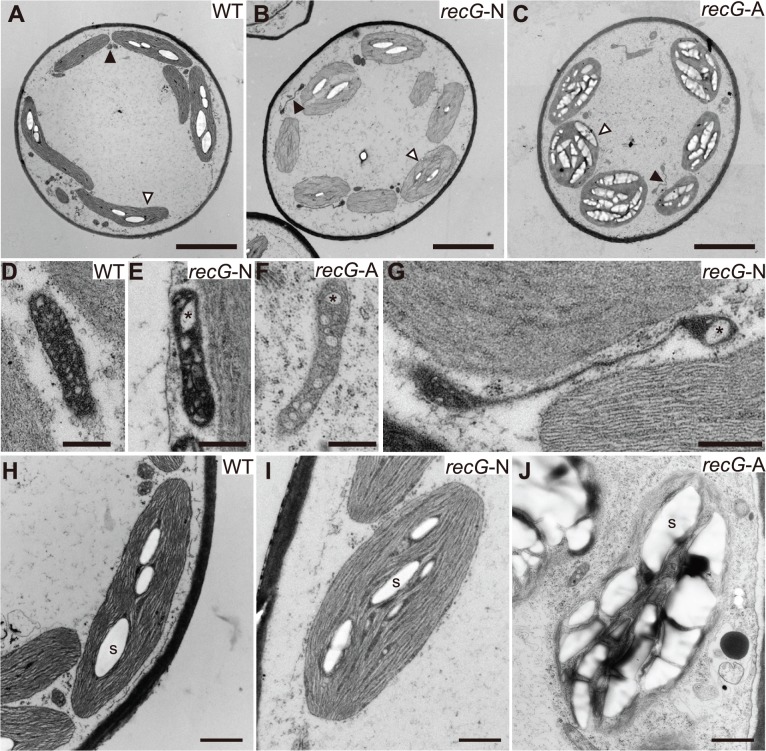
Fig 4. Ultrastructure of RECG KO protonemal cells.
Protonemal cells of WT, RECG KO normal (recG-N), and RECG KO atrophic (recG-A) were analyzed by TEM. A to C. Images of transversion sections of WT (A), recG-6N (B), and recG-6A (C) cells. Filled and blank arrowheads denote examples of mitochondrion and plastid, respectively. D to G. Mitochondria of WT (D), recG-3N (E), recG-3A (F), and recG-6N (G) cells. Cristae were appeared as small regions with low electron density. Asterisks denote examples of enlarged cristae. H to J. Plastids of WT (H), recG-3N (I), and recG-3A (J) cells. Examples of starch grains are indicated by S. Bars = 5 μm in (A) to (C), 500 nm in (D) to (G), and 1 μm in (H) to (J).

