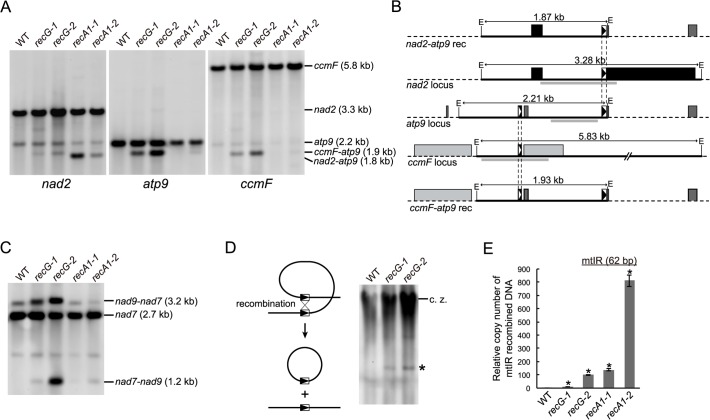
Fig 5. mtDNA rearrangements in RECG KO lines.
A. mtDNA configuration at nad2, atp9 and ccmF loci. DNA from WT, RECG KO and RECA1 KO strains digested with EcoRI was probed using nad2, atp9 and ccmF probes, as indicated below the blots. The predicted structure and length of the major bands are indicated on the right. B. Schematic representation of the DNA structures detected in (A). The EcoRI fragments corresponding to the bands on the blot in (A) and the flanking regions are represented by solid black lines and dashed black lines, respectively. The EcoRI recognition sites are indicated by E. The positions of the probes used in (A) are indicated by thick gray lines. The boxes represent exons, and the lines between boxes represent introns or noncoding flanking sequences. The 69 bp and 47 bp repeats are indicated by black triangles and white triangles in the boxes, respectively. C. mtDNA configuration at the nad7 locus containing 79 bp repeats. DNA from each of the indicated strains was digested with SacII and probed using nad7 probe. The structure of the fragments is detailed in Odahara et al. [6]. D. Production of deleted mitochondrial subgenome by recombination between repeats in nad7 and nad9. Left panel illustrates production of deleted subgenome by intramolecular recombination between direct repeats. Undigested DNA from WT and RECG KO strains was probed using nad7 probe. The asterisk denotes DNA corresponding to 11-kb subgenome. c.z., compression zone. E. The amount of DNA generated by recombination between mtIR (62 bp). Relative copy number of DNA resulting from recombination between mtIR per mitochondrial rpl2 DNA was measured by qPCR. WT was given a value of 1. The data represent mean of three replicates ± SD. *p<0.01 (versus WT).

