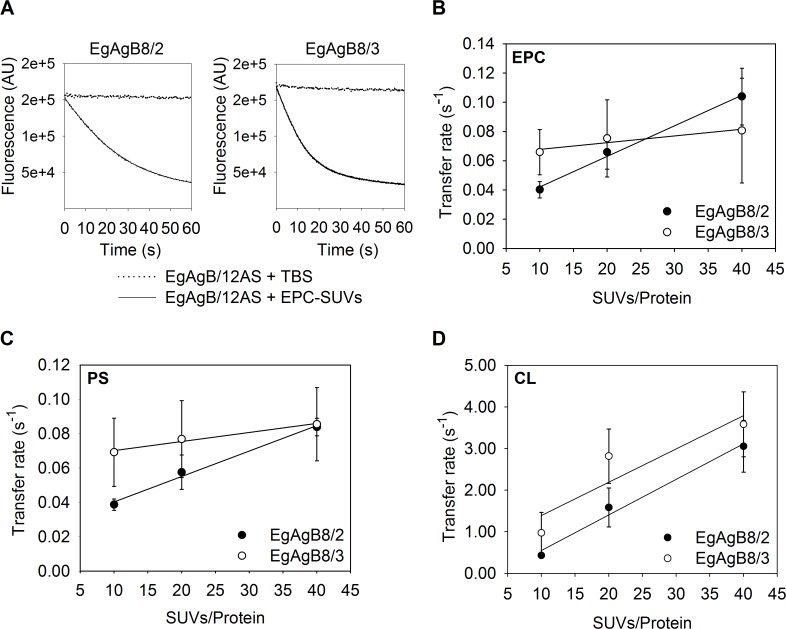
Fig 8. Effect of acceptor membrane concentration on 12-AS transfer from EgAgB8/2 and EgAgB8/3 to different SUVs.
Transfer of 12-AS from EgAgB8/2 or EgAgB8/3 to SUVs was monitored by adding SUVs in a molar ratio of 10:1, 20:1 and 40:1 (SUVs/Protein) to the complex EgAgB8/2:12AS or EgAgB8/3:12AS (15:1 mol:mol). (A) Representative kinetic trace obtained when combining EgAgB8–12AS with NBD-PC-containing vesicles (molar ratio SUV/Protein of 10:1). Photobleaching control adding TBS instead of NBD-PC/SUVs is shown. (B) SUVs containing 100% EPC; (C) 75% EPC, 25% PS or (D) 75% EPC, 25% CL were used. For each experimental condition at least five replicates of the kinetic curves were done. All curves were well-described by a single exponential function to obtain each transfer rate value employing SigmaPlot software. Transfer rates (mean ± SD) of three independent experiments are reported. Statistical analysis of the data was carried out employing ANOVA followed by Tukey's Post Hoc Test from GraphPad Prism software.

