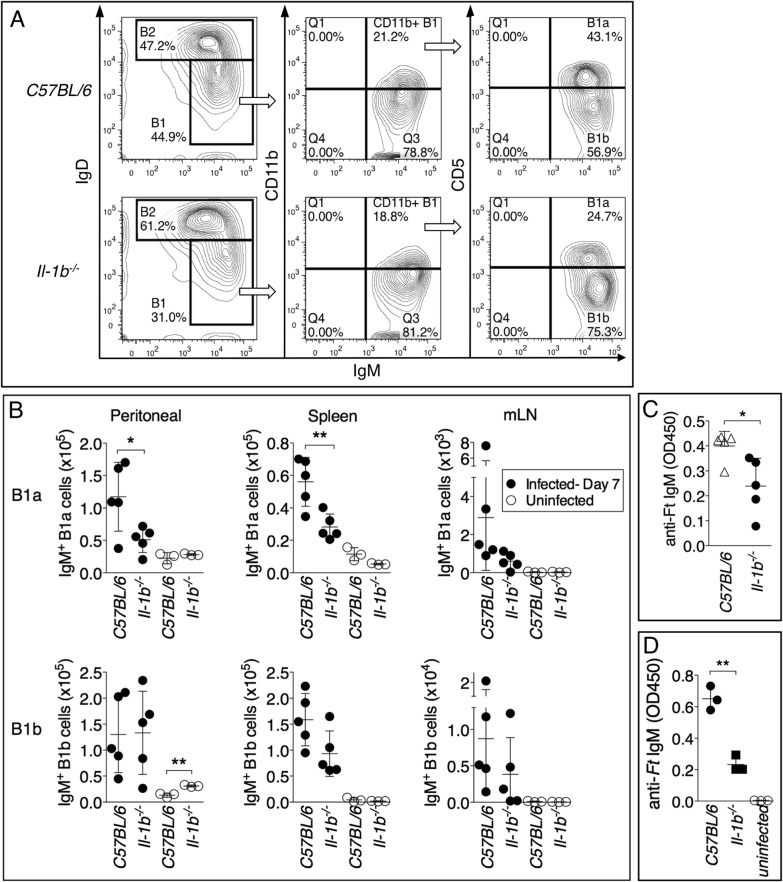
Fig 8. Reduced number of B1a B cells in Il-1b -/- mice infected with Ft LVS.
(A) Representative FACS profile and gating strategy to identify B1a and B1b B cells. (B) The number of B1a and B1b B cells was measured in peritoneal lavage, spleen, and mediastinal lymph nodes of indicated mouse strains intranasally infected with Ft LVS 103 CFU 6 days p.i. (C) Total spleen cells (5x10⁶ cells/ml) or (D) purified B1a B cells (x106 cells/ml) from mice infected as in A were cultured for 24 hours. IgM was measured in culture supernatants. One representative experiment of three is shown. Data are expressed as mean + S.D. *p<0.05, **p<0.01. Unpaired t-test.

