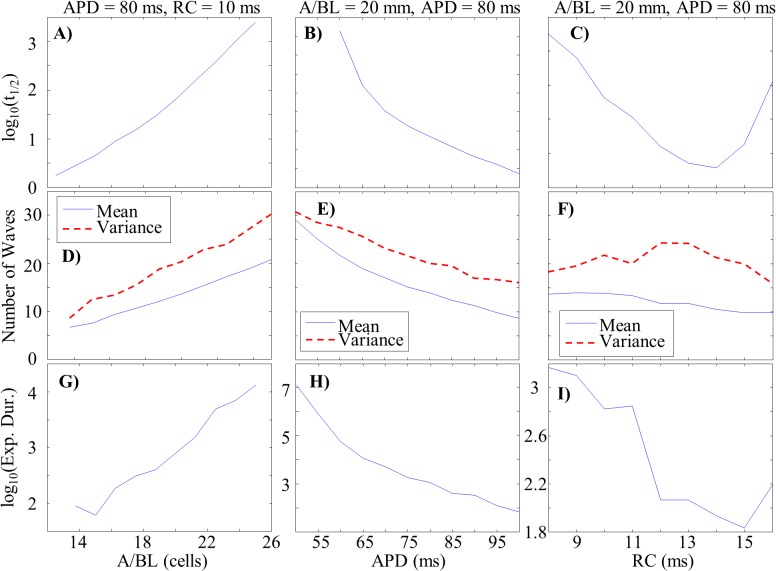
Fig 6. Parameter Dependencies of MWR Behavior.
A-C: Semi-log plots of MWR half-life as a function of A/BL (A), APD (B), and RC (C). D-F: The mean number of waves per time step (shown in blue) and population variance (shown in red) as functions of A/BL (D), APD (E), and RC (F). G-I: Semi-log plots of the expected duration of reentry (calculated from the population mean and variance) as a function of A/BL (G), APD (H), and RC (I). Note the similar parameter dependencies of MWR half-life and expected duration.

