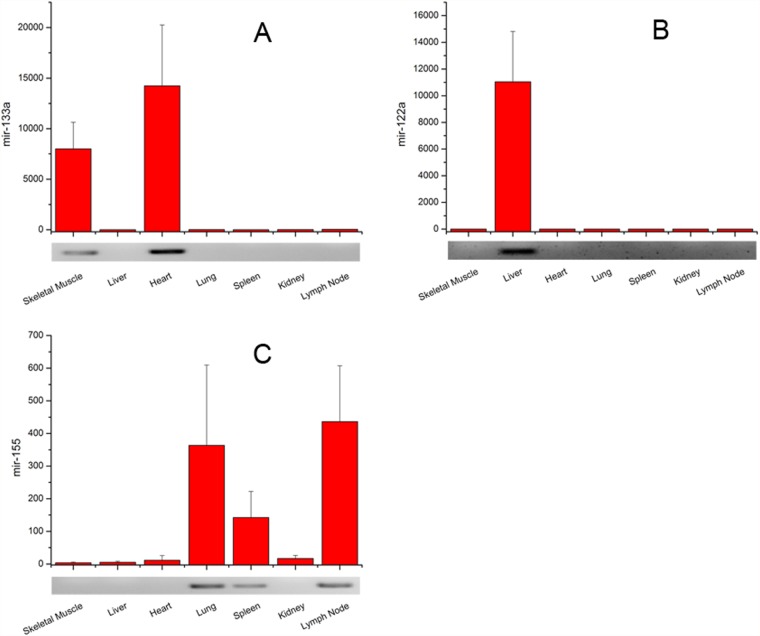
Fig 4. Quantification of miR-133a, miR-122a, and miR-155 expression in different tissues.
A bar graph shows the normalized expression value detected by qPCR for each miRNA, and an autoradiogram shows the average signal of Northern blot for three repeated experiments. In the bar graph, the signal from nine tissues was normalized to the internal control of Met-tRNA. The background signal obtained from the sample containing H2O instead of RNA was set to zero.

