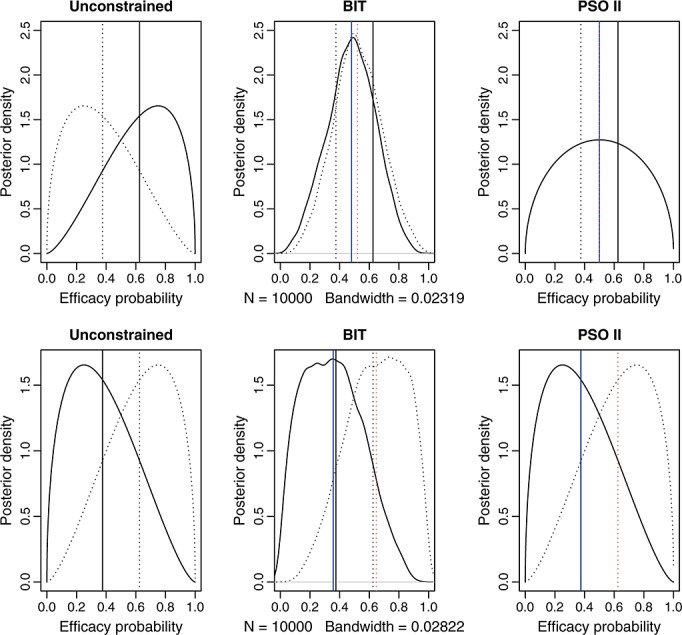
Figure 2.

The top three panels are posterior densities of the efficacy probability when two out of three and one out of three responses are observed at combinations (1,1) and (1,2), respectively. The bottom three panels are the corresponding posterior densities when one out of three and two out of three responses are observed at combinations (1,1) and (1,2), respectively. The solid and dotted curves are the density curves at combinations (1,1) and (1,2), respectively. The vertical lines indicate the posterior means, with black representing unconstrained and blue and red representing constrained posterior means, and the solid and dotted lines correspond to combinations (1,1) and (1,2), respectively. The blue solid and red dotted lines overlap on the top right panel; the black and blue solid lines overlap and the black and red dotted lines overlap on the bottom right panel. BIT, Bayesian isotonic regression transformation; PSO II, partial stochastic ordering using sample sizes as weights.
