Figure 7.

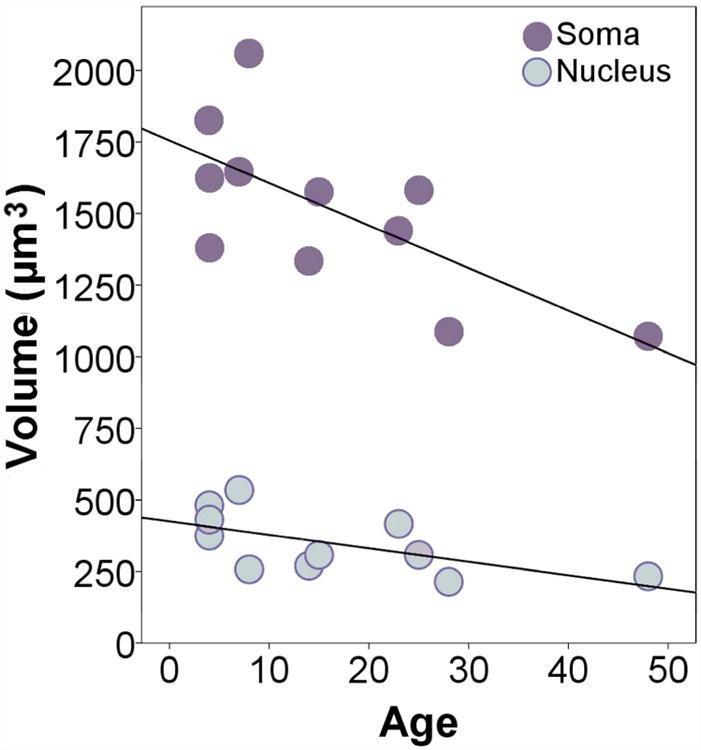
Regression plot indicating a negative relationship between age and volume of pyramidal soma and nuclei. Somal volume: y = 1755.04 -14.85×, R2 = 0.48, p = 0.02; Nuclear volume: y = 425.04 - 4.71×, R2 = 0.37, p = 0.05.

Regression plot indicating a negative relationship between age and volume of pyramidal soma and nuclei. Somal volume: y = 1755.04 -14.85×, R2 = 0.48, p = 0.02; Nuclear volume: y = 425.04 - 4.71×, R2 = 0.37, p = 0.05.