FIGURE 3.

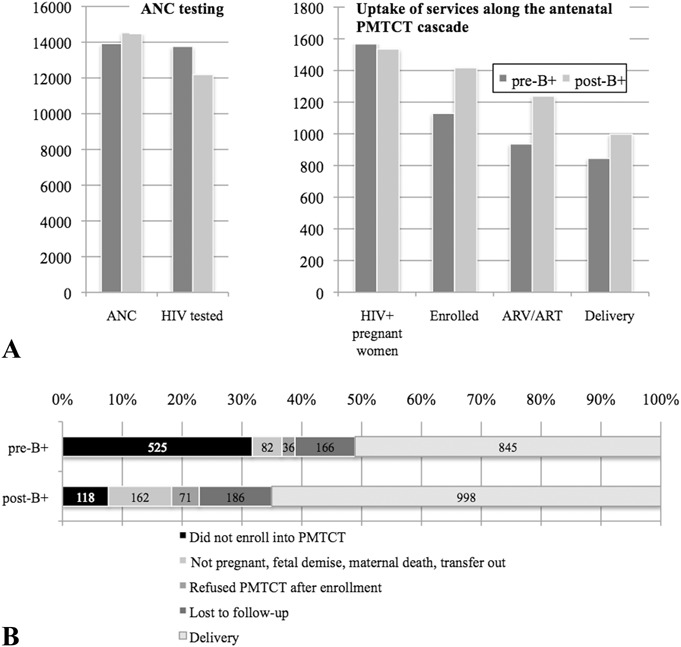
A, Uptake of services along the antenatal PMTCT cascade, pre-B+ and post-B+ implementation. B, Cumulative maternal outcomes of all women identified at ANC to delivery, pre-B+ (n = 1645) and post-B+ (n = 1535) implementation.

A, Uptake of services along the antenatal PMTCT cascade, pre-B+ and post-B+ implementation. B, Cumulative maternal outcomes of all women identified at ANC to delivery, pre-B+ (n = 1645) and post-B+ (n = 1535) implementation.