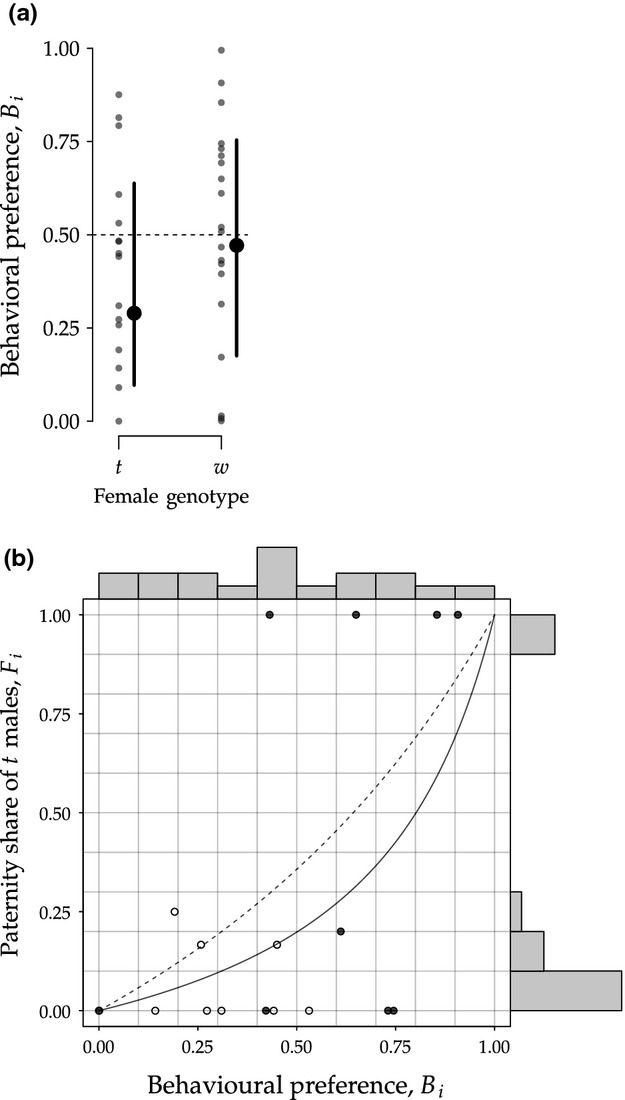
Figure 4.

(a) Behavioural preference for t males Bi as a function of maternal genotype including mean and 95% confidence interval estimates. The dashed horizontal line depicts the null hypothesis, that is no choice (Bi = 0.5). (b) Paternity share of t males Fi as a function of behavioural preference Bi. The colour of the dots represent female genotype (white: t, dark-grey: w). The histograms at the figure margins depict the distribution of the data in both x- and y-direction, illustrating that nearly uniformly distributed behavioural preference Bi translate into clear fertilization biases Fi. Dotted and solid lines show expected paternity shares for t and w females, respectively, based on null model 3. It is assumed that a female's behavioural preference Bi is proportional to the number of matings as well as the number of competing sperm of a given male. For example, if Bi = 0.5, both males contribute equally to the competing sperm pool. However – according to null model 3 – a proportion 1−1/(2τ) of a t male's sperm is dysfunctional.
