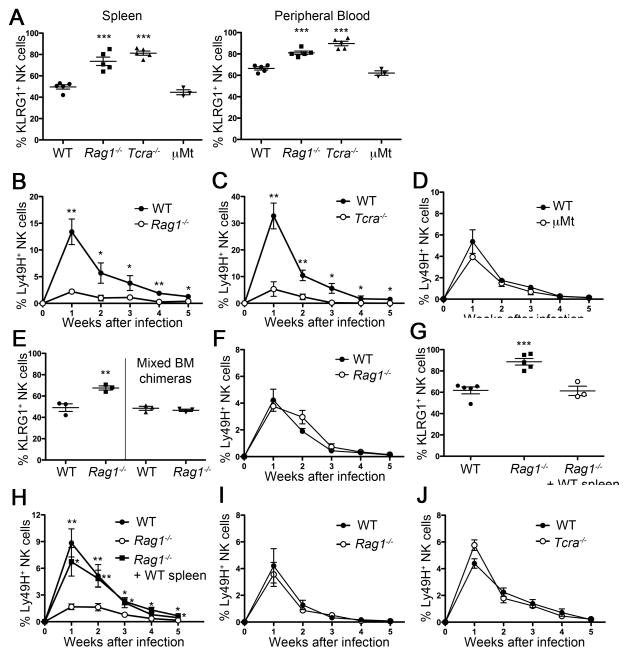
Figure 2. KLRG1int+ NK cells are increased in T cell-deficient mice, but not B cell-deficient mice.
(A) Percentages of KLRG1int+ cells within the total NK cell population in spleen and peripheral blood from the indicated mice. (B, C, D) NK cells were isolated from Rag1−/− mice (B), Tcra−/− mice (C), or μMt mice (D) (all CD45.2+) and co-transferred with an equal number of WT (CD45.1+) Ly49H+ NK cells. Graph shows percentages of Ly49H+ cells within the total NK cell population at the indicated time points after MCMV infection. (E) Percentages of KLRG1int+ cells within the total NK cell population in WT and Rag1−/− mice and in mixed bone marrow chimeric mice (1:1 mixture of WT (CD45.1+) and Rag1−/− mice (CD45.2+) cells). (F) WT and Rag1−/− NK cells were isolated from the mixed BMC mice (E), adoptively transferred into Ly49H- deficient hosts, and then infected with MCMV. Percentages of WT and Rag1−/− NK Ly49H+ NK cells after MCMV infection are shown. (G) Percentages of KLRG1int+ cells within the total NK cell population in WT and Rag1−/− mice and in Rag1−/− mice given WT spleen cells (5 × 10⁷ cells). (H) WT mice, Rag1−/− mice, and the Rag1−/− mice that received WT splenocytes were treated with anti-NK1.1 mAb and rested for 8 weeks. NK cells were isolated from these three groups of mice and an equal number of Ly49H+ NK cells was adoptively transferred into Ly49H-deficient hosts (day -1) and then infected with MCMV (day 0). Percentages of transferred Ly49H+ NK cells isolated from WT mice, Rag1−/− mice, and in Rag1−/− mice given WT spleen cells after MCMV infection are shown. (I, J) KLRG1− NK cells were sorted from WT (CD45.1+), Rag1−/− (CD45.2+) and Tcra−/− (CD45.2+) mice and an equal number of KLRG1−Ly49H+ NK cells from Rag1−/− (CD45.2+) or Tcra−/− mice were mixed (1:1) with WT NK cells, transferred into Ly49H-deficient hosts (day -1), and then infected with MCMV (day 0). Percentages of transferred Ly49H+ NK cells isolated from WT and Rag1−/− mice (I) and WT and Tcra−/− mice (J) are shown. Data are representative of two (C, I, J), three (E, F) and four (A, B) independent experiments. Error bars indicate SEM (n=3–5). See also Figure S2.

