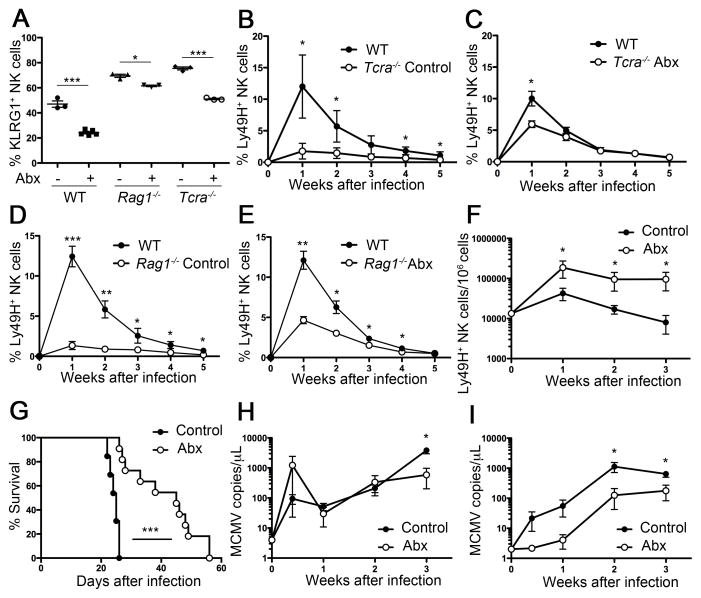
Figure 6. Antibiotic treatment improves NK cell responses to MCMV in T cell-deficient mice.
(A, B, C) WT, Tcra−/−, and Rag1−/− mice were given control or Abx-treated water for three weeks. (a) Percentages of KLRG1int+ cells within the total NK cell population in the indicated mice are indicated. (B) An equal number of Ly49H+ NK cells from Tcra−/− mice (CD45.2+) given control (B) or Abx-treated water (C) were mixed (1:1) with NK cells from WT mice (CD45.1+) and transferred into Ly49H-deficient mice, followed by MCMV infection. (D) An equal number of Ly49H+ NK cells from Rag1−/− mice (CD45.2+) given control (D) or Abx-treated water (E) were mixed with NK cells from WT mice (CD45.1+) and transferred into Ly49H-deficient mice, followed by MCMV infection. Graph shows percentages of each Ly49H+ population within the total NK cell population. (F, G, H, I) Rag1−/− mice were treated with control or Abx-treated water three weeks before MCMV infection and treatment was continued throughout the infection. (F) Number of Ly49H+ NK cells per million peripheral blood leukocytes (red blood cells-depleted fraction). (G) Survival of Rag1−/− mice treated either control water (n=13) or Abx-treated water (n=11). (H, I) Copy numbers of MCMV genomic DNA in peripheral blood (H) or oral lavage (I) were quantified by qPCR. Data are compiled from two independent experiments (G) or representative of two independent experiments with three to five (B, C, D, E), five (Abx-treated group in F, H, I) or seven (control group in F, H, I) mice per experiment. Error bars show SEM. See also Figure S5.

