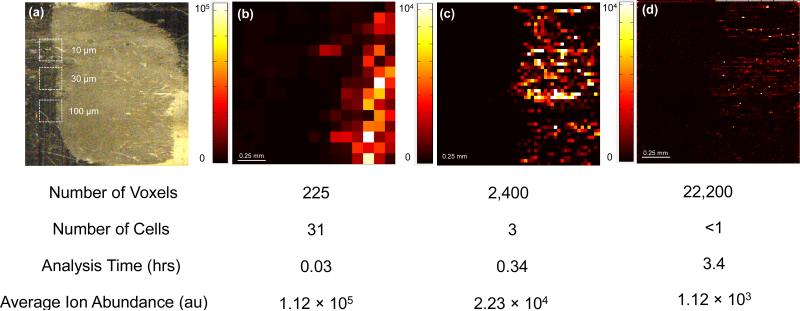
Figure 3.
The optical image of the tissue section and the areas analyzed are demonstrated in (a). Ion maps of cholesterol (m/z 369.3516 ± 5 ppm, [M-H2O+H+]+) at spot-to-spot distances of 100 μm (b), 30 μm (c), and 10 μm (d) are also presented. The number of pixels, number of cells in a voxel, average signal abundance, and analysis time are compared for each experiment.

