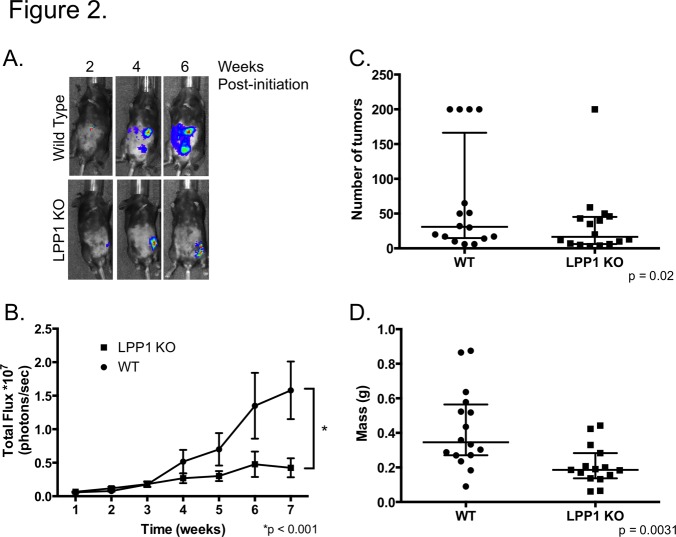
Fig 2. Peritoneal ovarian cancer growth is reduced in LPP1 KO mice.
Following IP injection of ID8ip2Luc cells, mice were imaged weekly to monitor tumor growth kinetically. (A) Representative luminescence images of wild type and LPP1 KO mice with tumor taken at 2-week intervals. (B) Quantification of total flux (photons/second) was determined weekly for wild type (n = 10) and LPP1 KO (n = 12) mice. Data represent mean ± std err; p < 0.001 determined by 2-way ANOVA followed by Tukey’s multiple comparisons test. (C) Data represent the number of macroscopic tumor nodules per mouse determined 8 weeks after tumor initiation. Mice with too many nodules to count were assigned a value of 200. Data represent median with 25th and 75th percentiles; p = 0.02 determined using the Wilcoxan-Mann-Whitney test. (D) Tumor volume was determined by weighing the omentum (primary site of tumor formation) and all associated tumor nodules 8 weeks after tumor initiation; each point indicates an individual mouse. Data represent median with 25th and 75th percentiles; p = 0.0031 determined by Student’s t-test.

