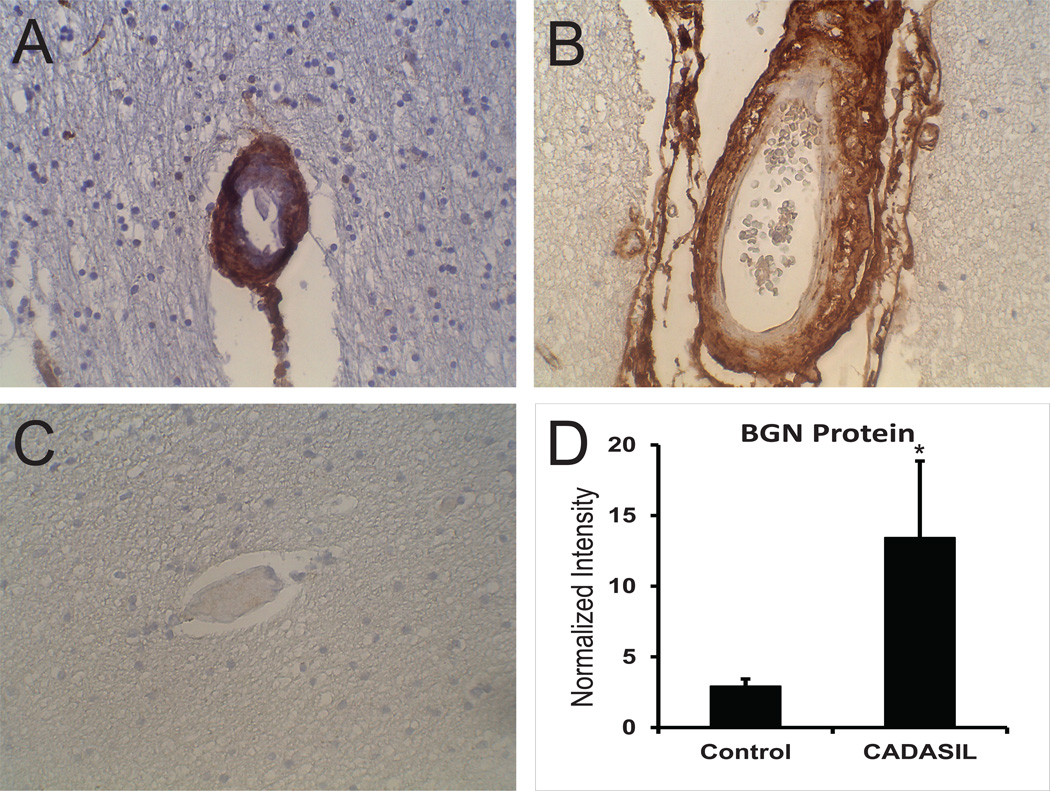
Figure 1.
BGN protein in CADASIL and control brain. Immunohistochemical analysis of genetically-defined CADASIL brains (A and B) and matched controls (C) was performed on frontal cortex sections with antibody 4E1-1G7. Penetrating arteries (A, C) and leptomeningeal (B) vessels are shown. Magnification is at 400x. (D) Brain lysates were analyzed by immunoblotting with 4E1-1G7 and the core BGN protein band was quantified for CADASIL and control frontal cortex, normalized to tubulin levels. Protein was not treated with glycosidases. Difference were significant (p<0.05) for CADASIL samples versus controls.

