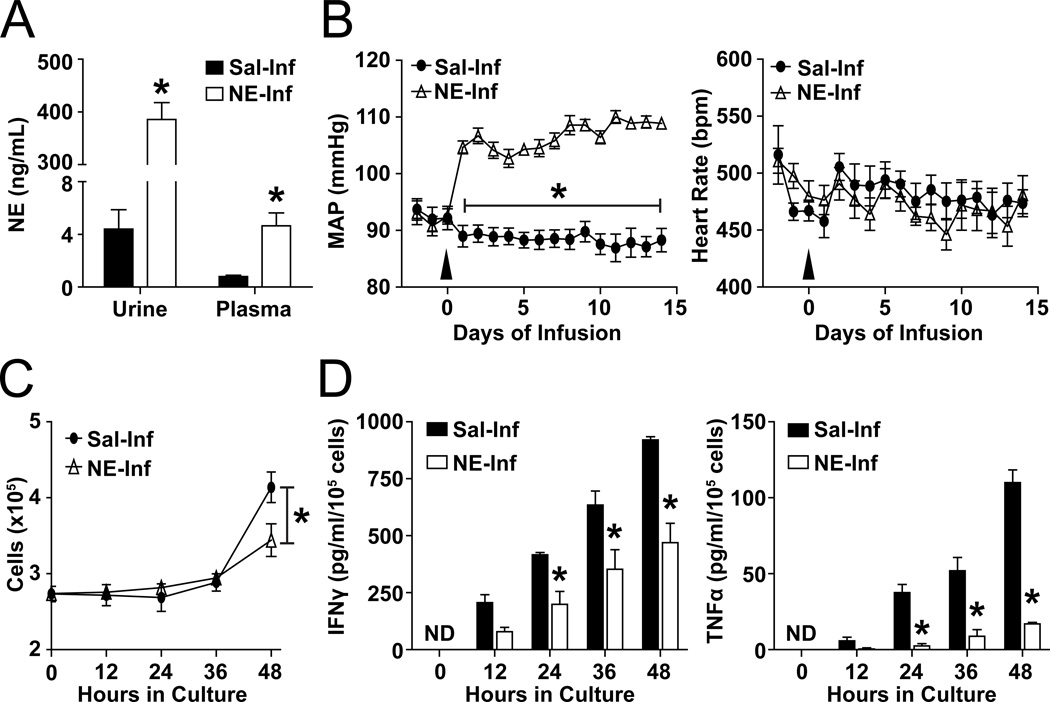
Figure 1. NE-induced hypertension suppresses splenic T-lymphocyte activation.
Mice were infused with saline or NE (3.8 µg/kg/min) for 14 days. A. Urine and plasma NE levels 14 days after saline or NE infusion. N=5. B. Mean arterial pressure (MAP) and heart rate (HR) during 14 days of saline or NE infusion. Arrow indicates start of NE infusion. N=8. C. T-lymphocyte numbers at 0–48 hours of ex vivo culture with CD3 stimulation. T-lymphocytes were isolated on day 14 after the start of saline or NE infusion, and plated for 48 hours with CD3 stimulation. N=4. D. IFNγ and TNFα levels in media at 0–48 hours of T-lymphocyte ex vivo culture. ND indicates non-detectable. N=4. *p<0.05 vs. saline-infused.

