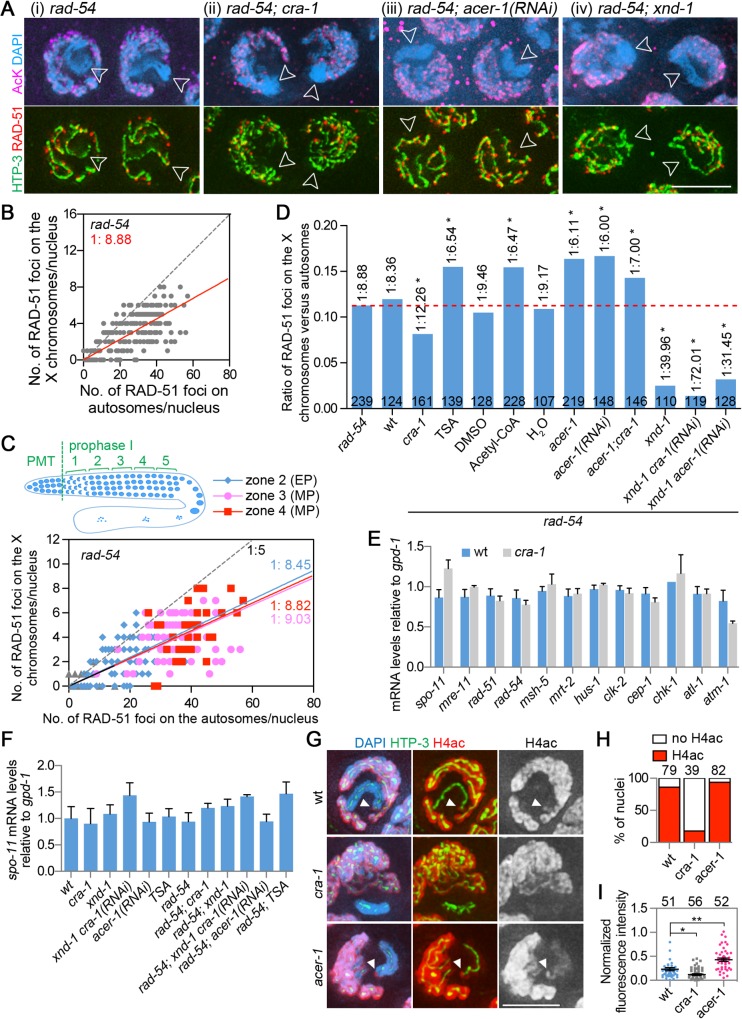
Fig 3. Analysis of DSB distribution, gene expression and histone acetylation.
(A) Gonads from the indicated genotypes were co-immunostained for HTP-3 (green), RAD-51 (red) and AcK (magenta). DNA was stained with DAPI (blue). Images are projections halfway through 3D data stacks of whole nuclei. The X chromosomes show low levels of AcK staining during early meiotic prophase (indicated by open arrowheads). Bar, 5 μm. (B) Graph depicts the distribution of RAD-51 foci on the X chromosomes and the autosomes during early meiotic prophase (from transition zone to mid pachytene combined). The average ratio of RAD-51 foci on the X versus autosomes is indicated. Dashed lines indicate a X/A ratio of 1:5. (C) Graph depicts the distribution of RAD-51 foci on the X and the autosomes during early meiotic prophase (from zones 2 to 4, early through mid-pachytene). The average ratios of RAD-51 foci on the X versus autosomes are indicated. The dashed line indicates a X/A ratio of 1:5. (D) The average ratios of RAD-51 foci on the X versus autosomes in indicated genotypes or treatments in the rad-54 mutant background. Data were analyzed as in (B). The numbers of nuclei scored for each genotype are indicated. Dashed red line depicts the ratio observed in rad-54 single mutants. * P<0.0001 by the extra sum-of-squares F test, compared to rad-54 single mutants. (E) Levels of spo-11 and DSB repair gene expression in dissected gonads from wild type and cra-1 mutants. Quantitative RT-PCR analysis revealed that the germline-specific gene expression for the depicted genes was not altered when comparing cra-1 to wild type and normalizing to gpd-1. Experiments were performed as in [26], utilizing the primers described therein. Error bars represent SEM for three biological replicates, each performed in duplicate. (F) Levels of spo-11 gene expression in indicated genotypes and treatment conditions. Quantitative RT-PCR was performed as in (E), except that whole worms were analyzed instead of dissected gonads. (G) Gonads from the indicated genotypes were co-immunostained for HTP-3 (green) and H4ac (red). DNA was stained with DAPI (blue). The white arrowheads indicate the H4ac-stained X chromosome tip. Bar, 3 μm. (H) Percentage of nuclei showing H4ac staining at the tip of the X chromosome in the indicated genotypes. The numbers of nuclei scored are indicated on the top. At least four gonads were scored for each genotype. (I) Average fluorescent intensity of H4ac along the X chromosomes and on the background was measured with Photoshop (Adobe systems Inc.) for each nucleus. The background fluorescent intensity was subtracted from the fluorescent intensity detected on the X chromosomes and this value was then normalized to the background fluorescent intensity. The numbers of nuclei measured are indicated on the top. At least four gonads were scored for each genotype. Bars represent the mean ± SEM. * P = 0.0006, ** P<0.0001, two-tailed Mann-Whitney test, 95% C.I.

