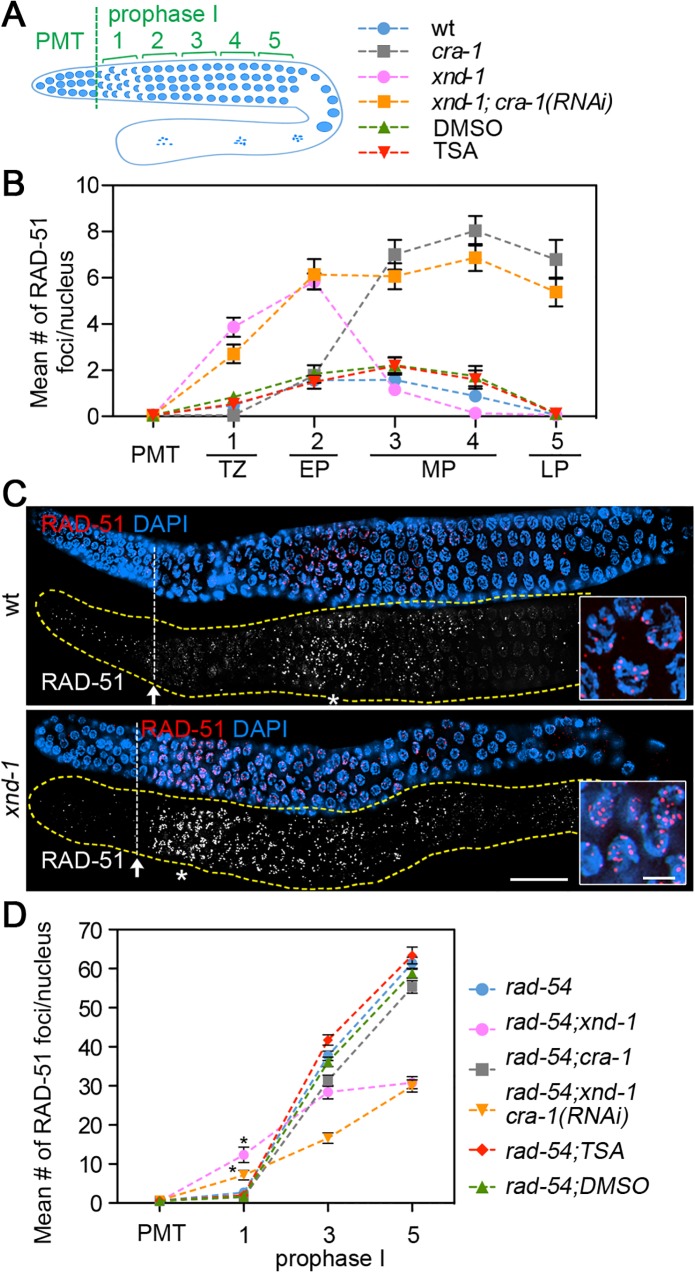
Fig 4. Time course analysis of DSB levels.
(A) Diagram of a C. elegans germline showing the position of the zones scored for a time course analysis of RAD-51 foci levels. PMT (premeiotic tip); zones 1–5 correspond to: transition zone (1), early (2), mid (3–4), and late (5) pachytene stages of prophase I. (B) Time course analysis of RAD-51 foci levels in the indicated genotypes. Gonads were co-stained with an anti-RAD-51 antibody and DAPI. The mean number ± SEM of RAD-51 foci scored per nucleus is indicated for nuclei in the premeiotic tip (PMT) and five zones of meiotic prophase: TZ, transition zone; EP, early pachytene; MP, mid-pachytene; LP, late pachytene. (C) Gonads from wild type and xnd-1 mutants were immunostained with an anti-RAD-51 antibody (red) and DNA was stained with DAPI (blue). Bar, 30 μm. Arrows show the position of meiotic entry. Asterisks show the position where levels of RAD-51 foci peak along the gonads in the different genotypes, and these regions are shown at a higher-magnification in the insets. Bar, 5 μm. (D) Graph shows the levels of RAD-51 foci observed along the germline in the indicated genotypes, all in a rad-54 background where DSB-bound RAD-51 is “trapped”. Data represent mean number and SEM of RAD-51 foci per nucleus for premeiotic tip (PMT) and three zones of the germline. * P<0.001 by the two-tailed t test, 95% C.I.

