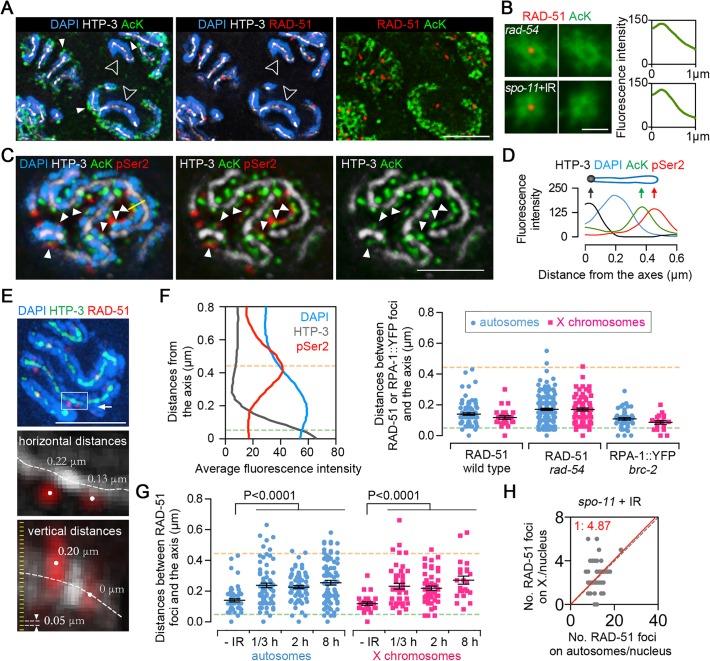
Fig 5. Sites of early meiotic recombination events are spatially separated from transcriptionally active chromatin.
(A) Gonads from rad-54 mutants were co-immunostained for HTP-3 (white), RAD-51 (red) and AcK (green, with a mouse anti-AcK antibody). DNA was stained with DAPI (blue). To facilitate visualization of individual chromosomes, images of pachytene nuclei correspond to 0.2 μm-thick projections from 3D data stacks consisting of 0.05 μm intervals. Bar, 4 μm. (B) Superimposition of at least 200 RAD-51 foci (red) captured from different nuclei from three different gonads at early pachytene in rad-54 mutants or γ-IR treated spo-11 mutants (20 min post-IR), showing that sites where DSB-bound RAD-51 foci are detected are devoid of AcK signal (green) (left panels). Average fluorescence intensity around the RAD-51 foci was measured by radial profile analysis (Image J) (right panels). Bar, 1 μm. (C) Co-immunostaining for CTD serine2-phosphorylated RNA polymerase II (pSer2) (red), AcK (green) and HTP-3 (white) in wild type worms. DNA was stained with DAPI (blue). To facilitate visualization of individual chromosomes, images of pachytene nuclei correspond to 0.2 μm-thick projections from 3D data stacks consisting of 0.05 μm intervals. Filled white arrowheads show examples where pSer2 and AcK are present at the same perichromosomal regions. Bar, 3 μm. (D) Fluoresence intensity was measured along the yellow line in (C) left panel, exemplifying how AcK and pSer2 are present at the tip of the chromatin loops. (E) Measuring the distances from RAD-51 foci to chromosome axes. Gonads were immunostained for RAD-51 (red) and HTP-3 (green). DNA was stained with DAPI (blue). Images were captured through whole nuclei at 0.05 μm intervals. Three-dimensional distances between the centers of RAD-51 foci and the centers of the axes (centers were defined by points of peak intensity) were measured with softWoRx Explorer (Applied Precision). Top image represents a stack of sections halfway through a whole nucleus. The horizontal and vertical distances from RAD-51 foci to the axes in the white box are shown at a higher resolution in the middle and bottom panels, respectively. Bar, 3 μm. (F) Left panel depicts the average fluorescence intensity of HTP-3 (gray line), DAPI (blue line) and pSer2 (red line) from the axis to chromosome periphery. Measurements were performed as in (D), and data represent average fluorescence intensity measurements for 41 germline nuclei from four different gonads. Yellow dashed line indicates the peak of pSer2 signal (tips of the chromatin loops). The HTP-3 signal corresponds to two parallel chromosome axes about 0.1 μm apart [30]. Thus, the axes are actually positioned about 0.05 μm from the center of the signal, depicted by a green dashed line (base of the chromatin loops). Right panel shows the distances between RAD-51 or RPA-1::YFP foci and chromosome axes. Gonads from wild type or rad-54 mutant worms were triple-stained as in (A) and gonads from brc-2; RPA-1::YFP worms were immunostained for YFP, HTP-3 and AcK. 3D distances from the centers of the RAD-51 or RPA-1::YFP foci to the center of the axes were measured in early meiotic prophase as performed in (E). Dashed lines depict the positions indicated in the left panel. Bars represent the mean distances ± SEM. (G) Measurement of distances between γ-irradiation induced RAD-51 foci and axes. A dose of 800 rads was used to induce DSBs in spo-11 mutants.—IR: analysis of early pachytene nuclei from rad-54 mutants. The hours indicate the time points post-irradiation in which the worms were dissected for immunostaining. Dashed lines depict the positions indicated in (F). Bars represent the mean distances ± SEM. (H) Distribution of RAD-51 foci between the autosomes and X chromosomes in spo-11 mutants exposed to 800 rads of γ-irradiation. Worms were dissected and fixed 20 min post-IR.

