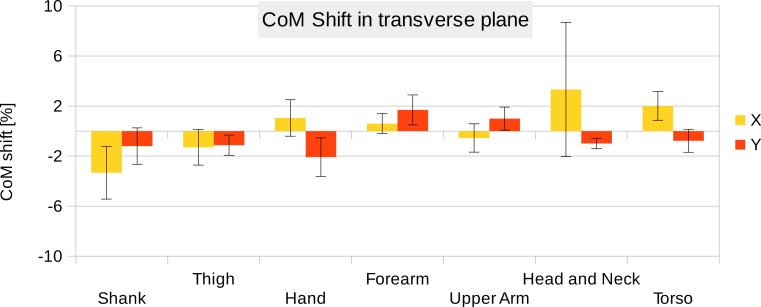
Figure 7. CoM shift from the anatomical longitudinal axis in the transverse (x–y) plane.
Average values of all six participants are shown (error bars show standard deviation). Due to mirror-symmetry, the y-values of the segments on the left- and right-hand side have opposite signs. To calculate the average, the sign of the segments on the left-hand side was inverted. The CoM is given as % of the segment length. The data of the foot is not included due to the participants wearing shoes.

