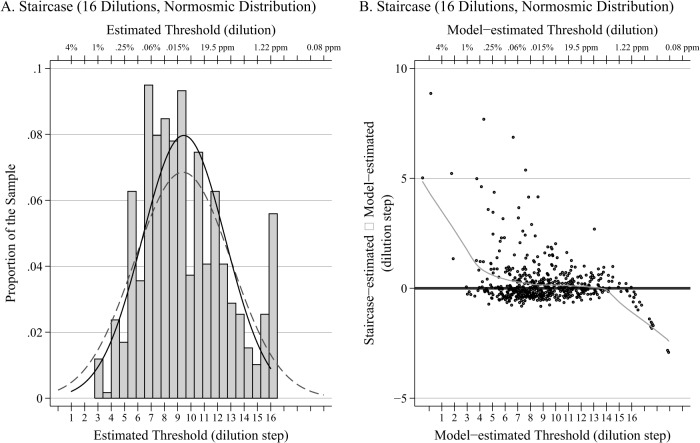
Fig 1. Histogram and Bland-Altman plot.
A. Histogram of 590 normosmic staircase-estimated thresholds (as determined by the mean of the last 4 reversals), together with a normal density curve with the same mean and standard deviation (solid black). In addition, the distribution of estimated thresholds from the fitted model is also plotted (dashed grey).B. Corresponding Bland-Altman plot comparing staircase-estimated thresholds and model-estimated thresholds among the 590 normosmics together with a LOWESS smoother.

