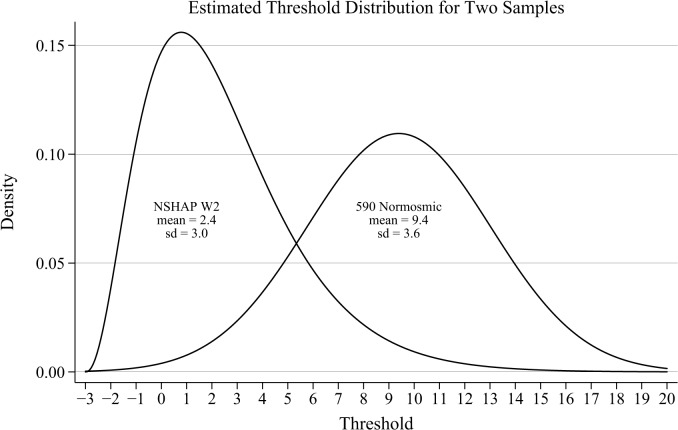
Fig 3. Distribution of Thresholds for Normosmics and NSHAP.
Threshold distributions used for simulations, based on model-estimated distributions for the 590 normosmic sample and the NSHAP Wave 2 sample (n = 2,207) of older adults. The means and standard deviations for both samples are as estimated by the IRT model; the Normal distribution for the NSHAP sample has been replaced by a gamma distribution with identical mean and standard deviation, to more closely approximate the likely distribution of thresholds in the population.

