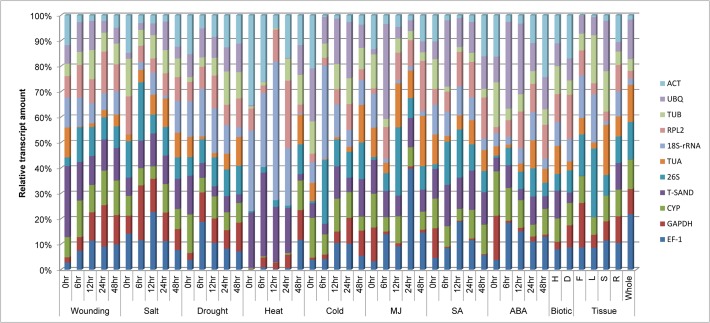
Fig 2. Distribution of transcript populations of 11 selected genes under different stress treatments.
In each treatment, the transcript amount of each gene is shown as a ratio relative to the sum of the 11 transcript populations. The samples were collected at 0hr, 6hr, 12hr, 24hr and 48hr interval of time after each treatment. Different treatments were heat, cold, drought, wounding, salt, MJ, SA, ABA, biotic and tissue (Flower, leaf, stem root and whole plant).

