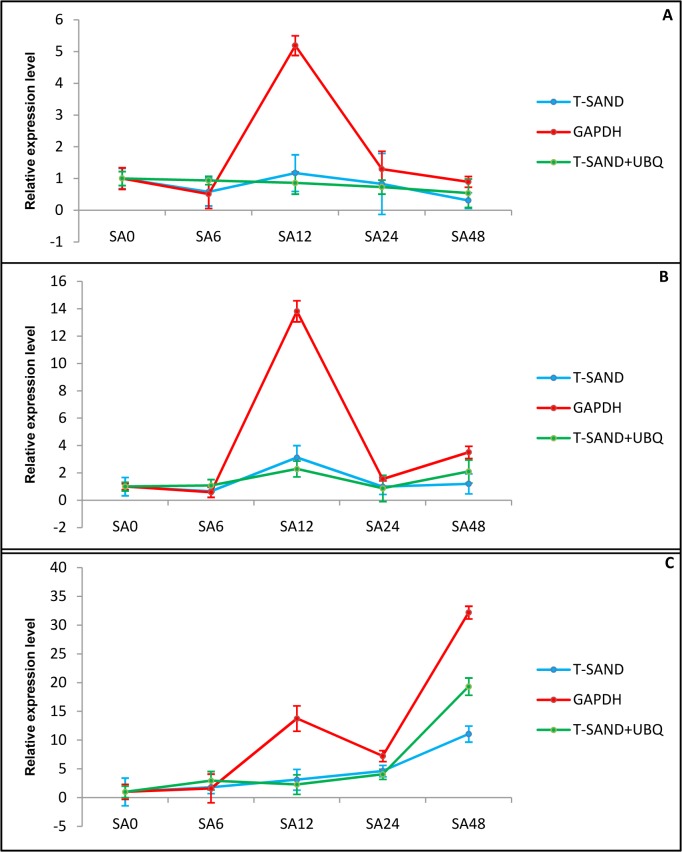
Fig 5. Relative expression level of withanolides biosynthesis genes in response to SA treatment.
Transcript level relative quantification of HMGR (A), CAS (B) and P450 (C). The most stable genes recommended for SA treatment (T-SAND and UBQ) and the least stable gene GAPDH were used for normalization. For T-SAND and UBQ geometric mean was calculated and used for normalization of expression. Error bars show standard deviation calculated from three biological replicates.

