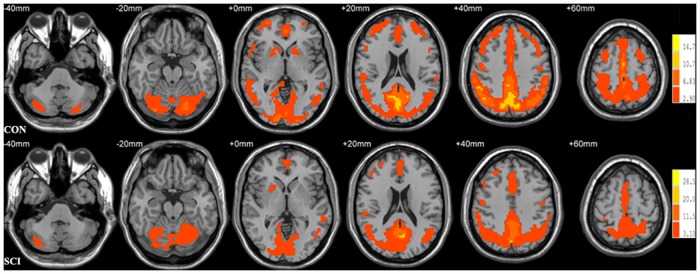
Fig 1. Results of one-sample t-test on ReHo maps for healthy controls (CON, uppper) and patients with acute SCI (SCI, lower).

Threshold was set to p<0.05 with AlphaSim correction. The left side of the image corresponds to the right hemisphere of the brain. The underlying structure image is Ch2 image.
