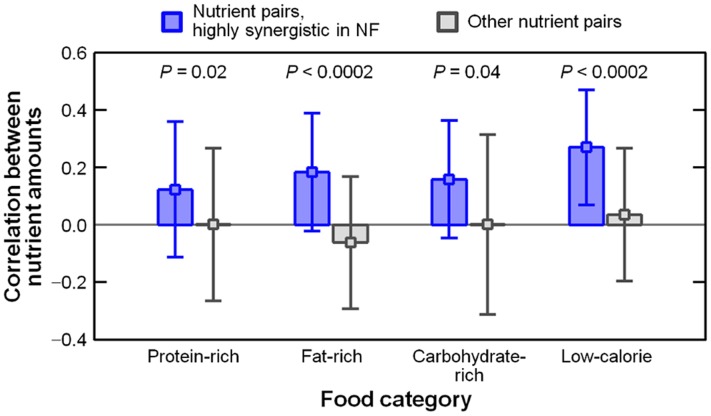
Fig 3. Correlations between the abundances of two nutrients (one nutrient is favorable and the other nutrient is unfavorable for NF) across the foods in each food category.
For highly synergistic nutrient pairs (Φij > 2.0; blue) and the other pairs (Φij ≤ 2.0; grey), we present the respective averages and standard deviations of the correlations (see the Materials and Methods section and S1 Appendix, Section 6.2).

