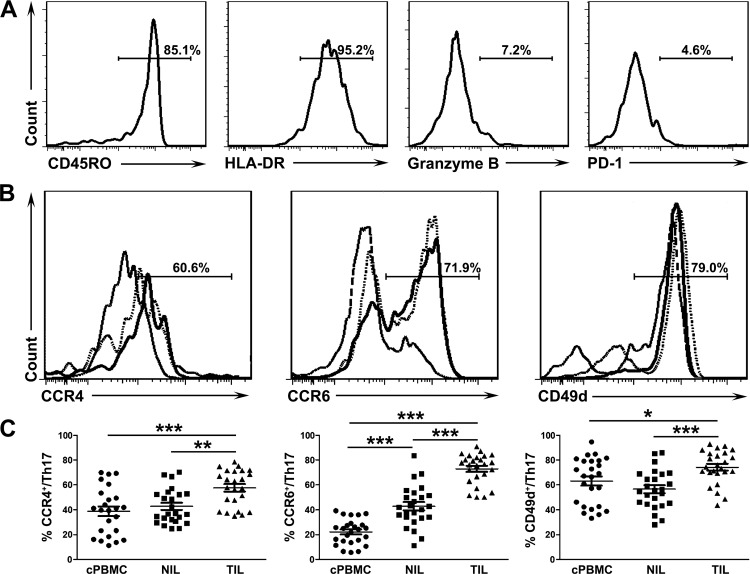
Fig 3. Phenotypic analysis of Th17 cells in patients with cervical cancer.
(A) Representative expression profiles of CD45RO, HLA-DR, Granzyme B and PD-1 in tumor-infiltrating Th17 cells. The percentages represent the frequencies of various markers in Th17 cells. (B) Representative expression profiles of CCR4, CCR6 and CD49d on Th17 cells from peripheral blood (long dotted line), non-tumor (dotted line) and tumor tissues (solid line). The percentages represent the frequencies of various markers on tumor-infiltrating Th17 cells. (C) Statistical analysis of surface expression of CCR4, CCR6, CD49d on Th17 cells from peripheral blood, non-tumor and tumor tissues (n = 25). *P < 0.05, **P < 0.01, ***P < 0.001.

