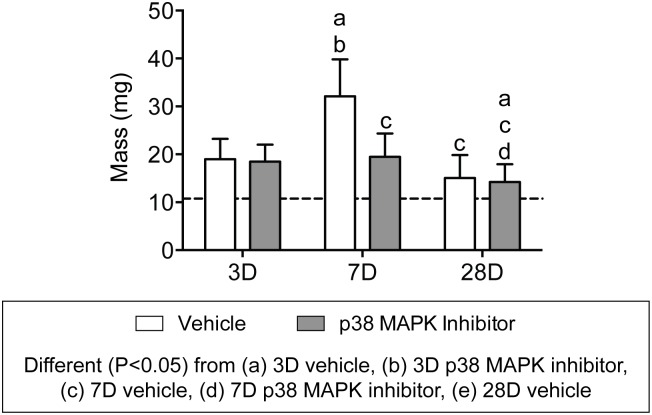
Fig 2. Plantaris tendon mass values.
Values are mean±SD, N = 8 for each group. Differences between groups were tested using a two-way ANOVA (α = 0.05). Newman-Keuls post hoc sorting was used to determine differences between groups, and significant interactions (P<0.05) are indicated above each group.: a, different (P<0.05) from 3D vehicle; b, different (P<0.05) from 3D p38 MAPK inhibitor; c, different (P<0.05) from 7D vehicle; d, different (P<0.05) from 7D p38 MAPK inhibitor; e, different (P<0.05) from 28D vehicle. For reference, horizontal dashed line indicates wet mass of plantaris tendons that were not subjected to synergist ablation.

