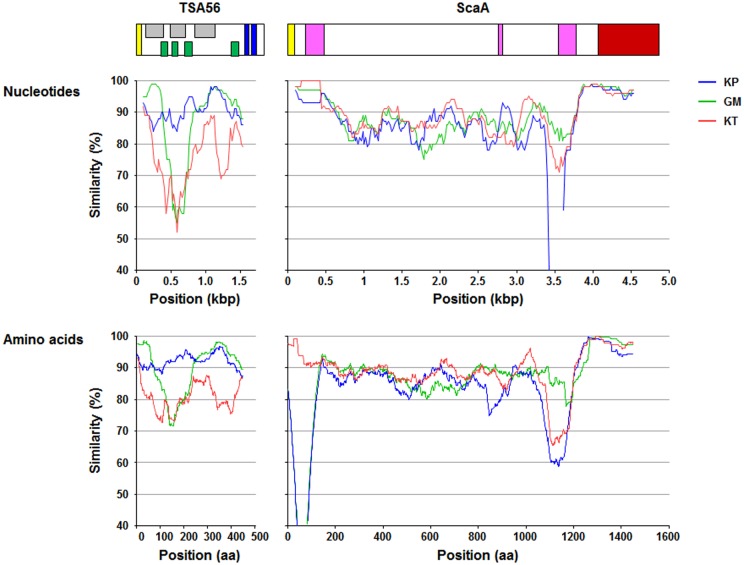
Fig 5. Similarity plots of a set of tsa56 and scaA sequences from the indicated strains compared to sequences from the Boryong strain.
Each plotted point is the percent identity within a sliding window of 100 bp or 100 amino acids wide centered on the position plotted, with a step size between points of 10 bp or amino acids. Diagrams above the graphs show the relative sizes of TSA56 and ScaA proteins and their sequence motiffs. Yellow box: signal peptide, gray box: antigenic domain, green box: variable domain, blue box: transmembrane domain, pink box: repeated sequences, brown box: autotransporter domain.

