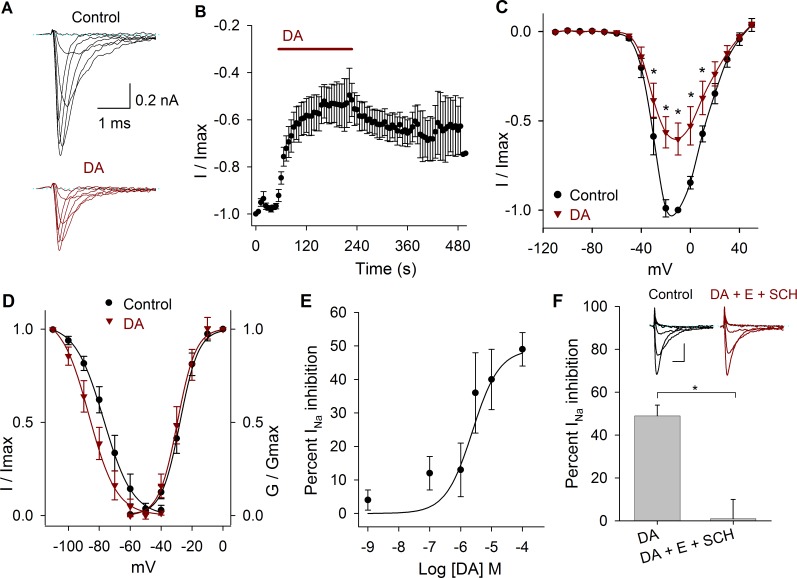
Fig 2. Effects of DA on the INa.
A) Representative experiment showing the effect of 10 μM DA after control perfusion. B) Temporal course of the inhibitory action of DA 100 μM on the INa amplitude. Bar indicates the DA perfusion. C) Current-voltage relationship in control and with 10 μM DA. DA decreased the INa by 43 ± 8% at −20 mV (P = 0.001; n = 9). D) Activation and inactivation curves in control and after DA application. DA caused a hyperpolarizing shift of the V½ of the inactivation curve of 8 mV at 10 μM (P = 0.8). In this and following activation and inactivation curves the data were fitted with a Boltzmann function (solid lines). E) Concentration-response relationship of the effect of DA (1 nM to 100 μM), with at least n = 6 for each point. The data were fitted with a concentration response curve (solid line) with an IC50 of 2.5 x 10⁻⁶ M and a Hill coefficient of 1. F) Bar graph shows that a mixture of D1 and D2 antagonists (100 μM SCH-23390 + 1 μM eticlopride) completely blocks DA action (P = 0.006). Inset show a representative recording of the SCH-23390 (SCH) and eticlopride (E) actions. Calibration bars 0.2 nA and 1 ms. Asterisks denote a significant effect P < 0.05.

