
Fig 1.
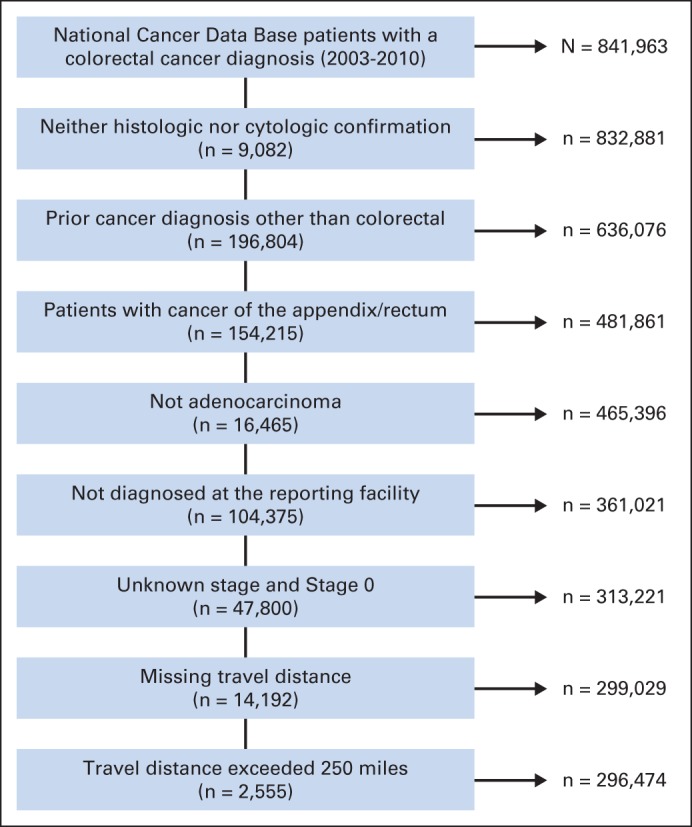
Flow chart of cohort inclusion/exclusion criteria. Values on the left side of the diagram indicate No. of patients excluded. Values on right side indicate No. of patients included.
Official websites use .gov
A
.gov website belongs to an official
government organization in the United States.
Secure .gov websites use HTTPS
A lock (
) or https:// means you've safely
connected to the .gov website. Share sensitive
information only on official, secure websites.
Flow chart of cohort inclusion/exclusion criteria. Values on the left side of the diagram indicate No. of patients excluded. Values on right side indicate No. of patients included.