
Figure 1. Phenotypes of BM-derived DTCs.
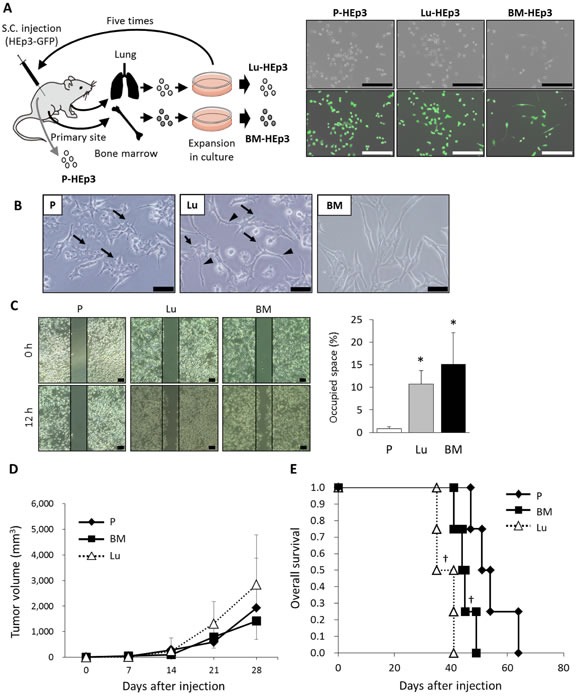
(A) Schematic representation of the procedure used for in vivo selection (left panel). HEp3 cells expressing green fluorescent protein (GFP) (5 × 10⁶) were injected subcutaneously (S.C.) into mice. At 30-40 days after injection, HEp3 cells in the primary site (P-HEp3) and DTCs in lung and BM were isolated and then expanded in monolayer culture. After subconfluent growth, lung- and BM-derived cells were injected subcutaneously into mice again. These transplantations were repeated five times, and the resultant sublines derived from BM and lung were called BM-HEp3 and Lu-HEp3, respectively. Phase-contrast and corresponding images merged with GFP fluorescence for P-HEp3, Lu-HEp3, and BM-HEp3 cells are shown (right panels). Scale bars indicate 400 μm. (B) Representative images of cell morphology of the P-HEp3 (P), Lu-HEp3 (Lu), and BM-HEp3 (BM) sublines. Scale bars indicate 50 μm. Arrows and arrowheads indicate filopodia-like and dendrite- or axon-like protrusions, respectively. (C) The HEp3 sublines were wounded by scratching and were then incubated in serum-free medium for 12 hours. Cell migration into the wound area was visualized with a phase-contrast microscope and photographed. Representative photographs are shown (left panels), and the quantitative results provide the means ± SEM of triplicate samples (right panel). *P < .01. (D) Tumor growth after the HEp3 sublines were injected subcutaneously into mice. The graph shows mean tumor growth rates ± SD for four animals per experimental condition. (E) Kaplan-Meier plots of overall survival of each experimental group. †P < .05 (log-rank test).