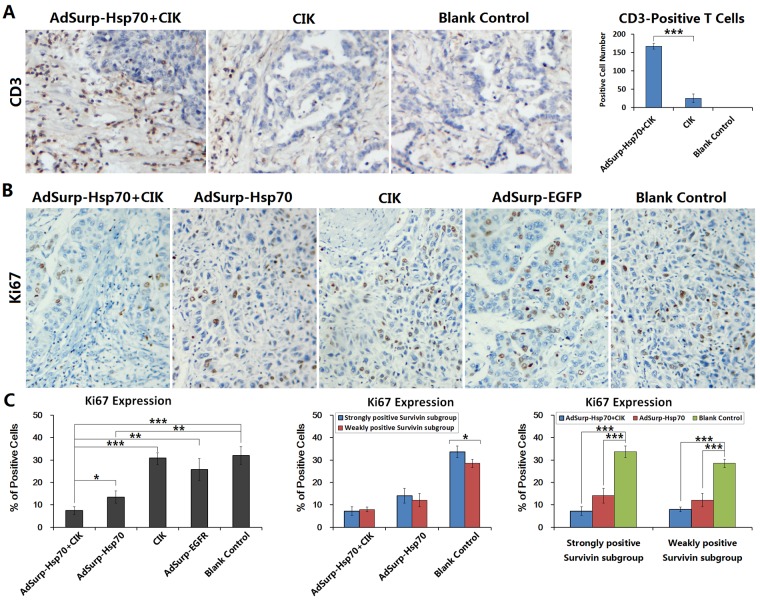
Figure 5. CIK cell infiltration in tumor stroma and Ki67 expression in cancer cells.
(A) Tumor xenografts were collected to prepare the paraffin-embedded sections as aforementioned. Immunohistochemical staining was performed to observe the number and distribution of the infiltrated CD3+ T cells in tumor stroma. For each slice, the number of positive cells was counted within 5 medium-power magnification fields of view (20× objective lens) under microscope. The results were determined by scoring the stained cell ratio and the staining intensity; original magnification: ×200; ***P<0.001. (B) Immunohistochemical staining was performed to observe the expression of the proliferating cell nuclear antigen Ki67 in tumor cells; original magnification: ×200. (C) The number of positive cells was counted within 5 medium-power magnification fields of view (20× objective lens) under microscope. Each experimental group was divided into a weakly positive Survivin subgroup and a strongly positive Survivin subgroup to further compare Ki67 expression in cancer cells; *P<0.05, **P<0.01, ***P<0.001.

