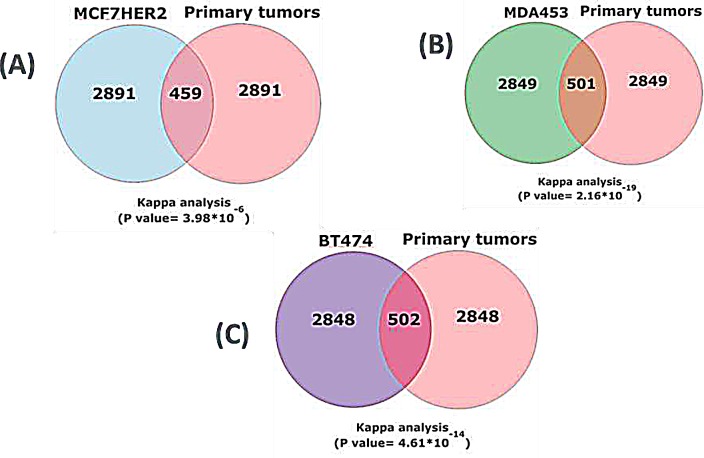
Figure 1. Concordant HER2-correlated changes in gene expression in cell lines and primary breast cancer tissue.
Expression array data from 812 primary breast cancers were collected, normalized and merged together (20). The 35% highest expressed HER2 samples are considered as HER2 positive and the 35% lowest expressed HER2 are considered as HER2 negative. The gene differential expression analysis was performed on HER2+ and HER2− tumor samples by LIMMA. 3350 significant genes with p-value less than 0.05 were selected and compared to 3350 transcripts with the most significant changes in cell lines (p < 0.05). Kappa analysis measured the significance of directionality for (A) MCF7HER2 vs primary tumors, (B) MDA453 vs primary tumors and (C) BT474 vs primary tumors.

