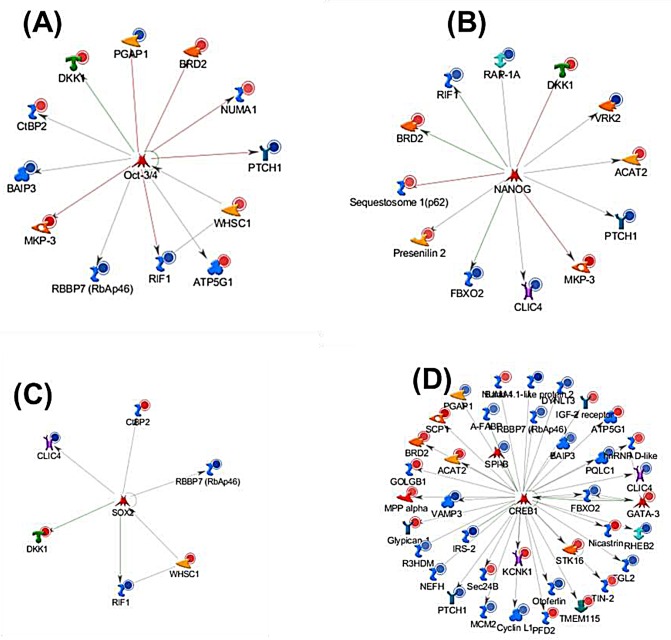
Figure 3. Gene ontology (MetaCore) analysis of 113 genes with poised POL II binding sites in high HER2-expressing breast cancer cell lines and differentially expressed in HER2+/− breast carcinomas.
Networks are graphically visualized as nodes (proteins) and edges as relationship between proteins. The line colors designate the nature of the interaction; red= negative effects, green=positive effects gray is unspecified. Blue and red circles represent down regulated and up regulated genes in HER2+/− primary breast tissues respectively. Transcriptional factor (A) OCT3/4, (B) NANOG, (C) SOX2 and (D) CREB1 interact with 11, 11, 6 and 38 genes respectively.

